Services
Our Sustainability
Services
KDS works with energy simulation, daylight design, site conservation, water efficiency, material selection, thermal comfort, carbon footprint, traffic analysis & many other sustainable aspects.
Suspendisse convallis mi ac nulla rhoncus dapibus. In hac habitasse platea dictumst. Curabitur nec metus sed mauris pretium gravida. Maecenas nec ligula nec nulla tempus euismod.
01.
Project Benchmarking
Click edit button to change this text. Lorem ipsum dolor sit amet, consectetur adipiscing elit. Ut elit tellus, luctus nec ullamcorper mattis, pulvinar dapibus leo.
Nemo enim ipsam voluptatem quia voluptas sit aspernatur aut odit aut fugit, sed quia consequuntur magni dolores eos qui ratione voluptatem sequi nesciunt. Neque porro quisquam est, qui dolorem ipsum quia dolor sit amet, consectetur, adipisci velit.

02.
Building Performance Analysis
Click edit button to change this text. Lorem ipsum dolor sit amet, consectetur adipiscing elit. Ut elit tellus, luctus nec ullamcorper mattis, pulvinar dapibus leo.
Nemo enim ipsam voluptatem quia voluptas sit aspernatur aut odit aut fugit, sed quia consequuntur magni dolores eos qui ratione voluptatem sequi nesciunt. Neque porro quisquam est, qui dolorem ipsum quia dolor sit amet, consectetur, adipisci velit.

03.
Continuing Education
Click edit button to change this text. Lorem ipsum dolor sit amet, consectetur adipiscing elit. Ut elit tellus, luctus nec ullamcorper mattis, pulvinar dapibus leo.
Nemo enim ipsam voluptatem quia voluptas sit aspernatur aut odit aut fugit, sed quia consequuntur magni dolores eos qui ratione voluptatem sequi nesciunt. Neque porro quisquam est, qui dolorem ipsum quia dolor sit amet, consectetur, adipisci velit.

Solutions
Our Offerings
- Green Building Certification
- Design Assistance
- Water Conservation
- Software Training
- Indoor Environmental Quality
- CDM & Carbon Management
- Energy Audits & Commissioning
- EC & HRC Services
- Impact Assessment Studies
- Sustainability Reporting
- Awareness Programmes

High Performance Building Design
Repellat nulla pretium molestias laoreet. Urna fugiat sem metus, cum diamlorem dolorum, consectetur.
Offerings
- Solar Passive Analysis
- Microclimate & Wind Flow
- Energy Simulation
- Daylight Harvesting
- Façade Design
- Renewable Generation
- Solar Stress Control
- Natural Ventilation
- CFD Analysis
- System Optimisation
- Dynamic Thermal Studies
Solutions
Environmental Requisites


Solar Analysis
Repellat nulla pretium molestias laoreet. Urna fugiat sem metus, cum diamlorem dolorum, consectetur.
Site Climate Data
- Longitude - 76.47 E
- Latitude - 30.44 N
- Altitude - 304-365 Meters Above MSL
- Temperature - Winter - Min. 1* C - 16* C ( Nov. - Jan.) Summer - Min. 27* C - 44* C ( April - July)
- Wind Direction - West & North West In Summer & Winter
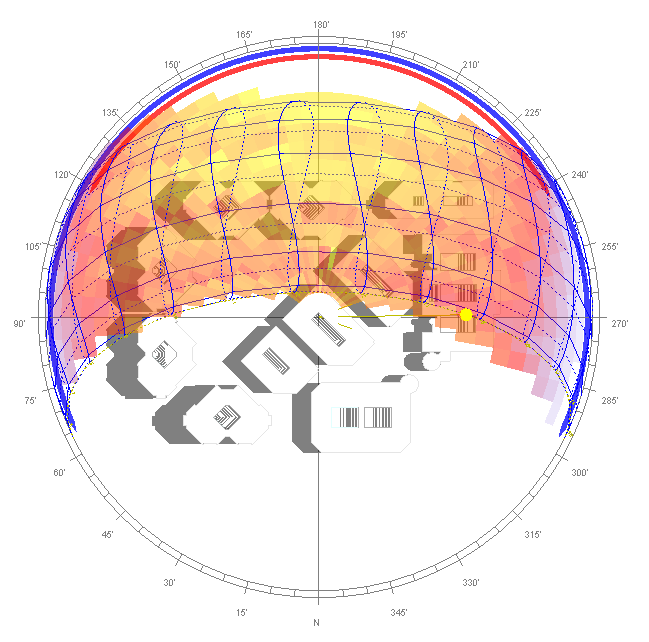

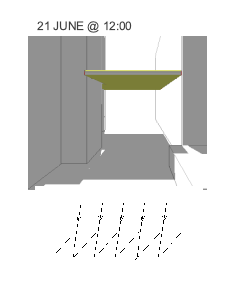
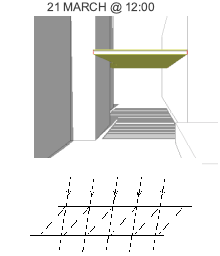
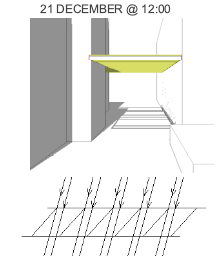
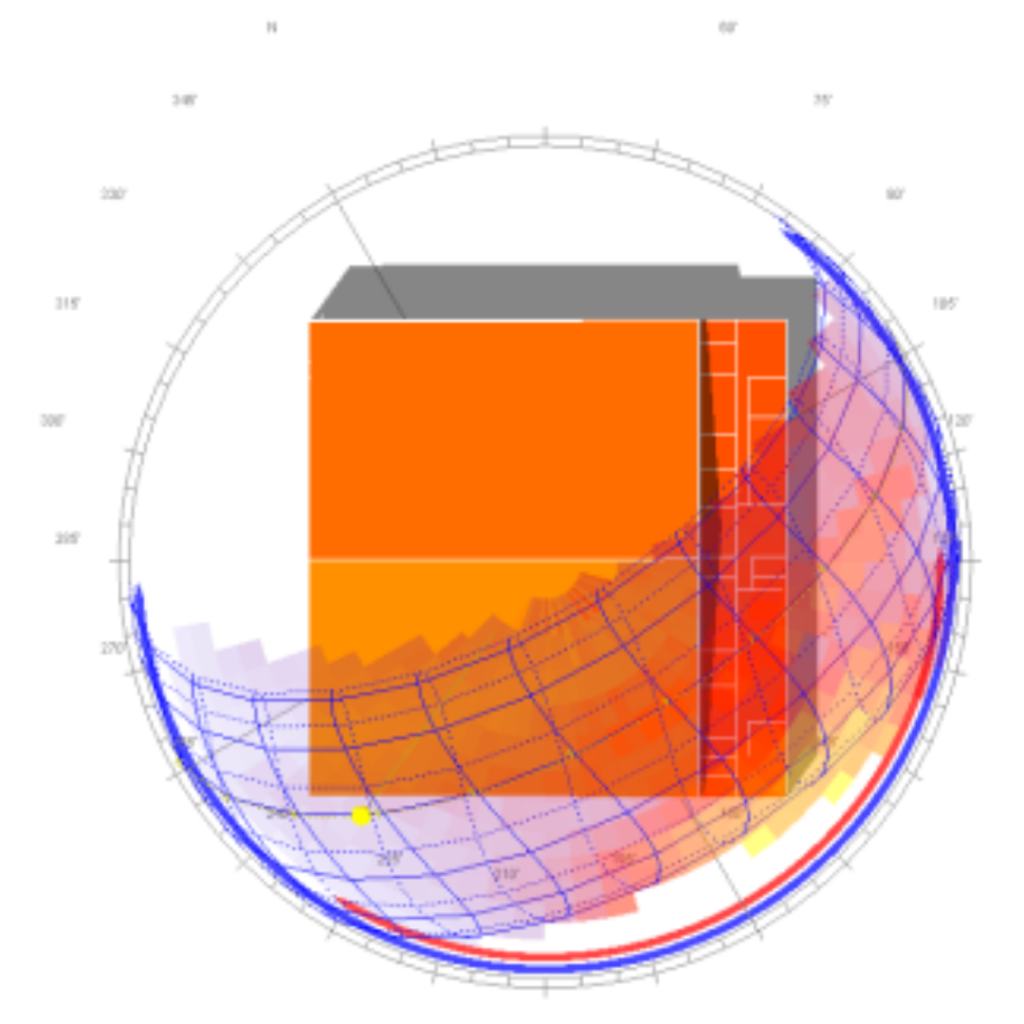
Shading Analysis
After analyzing the Solar path diagrams & Temperature data, Sun Shades are designed in such a way ( as can be seen in the diagrams) that it will allow the winter sun to come in the courtyards but it will block the summer sun completely.
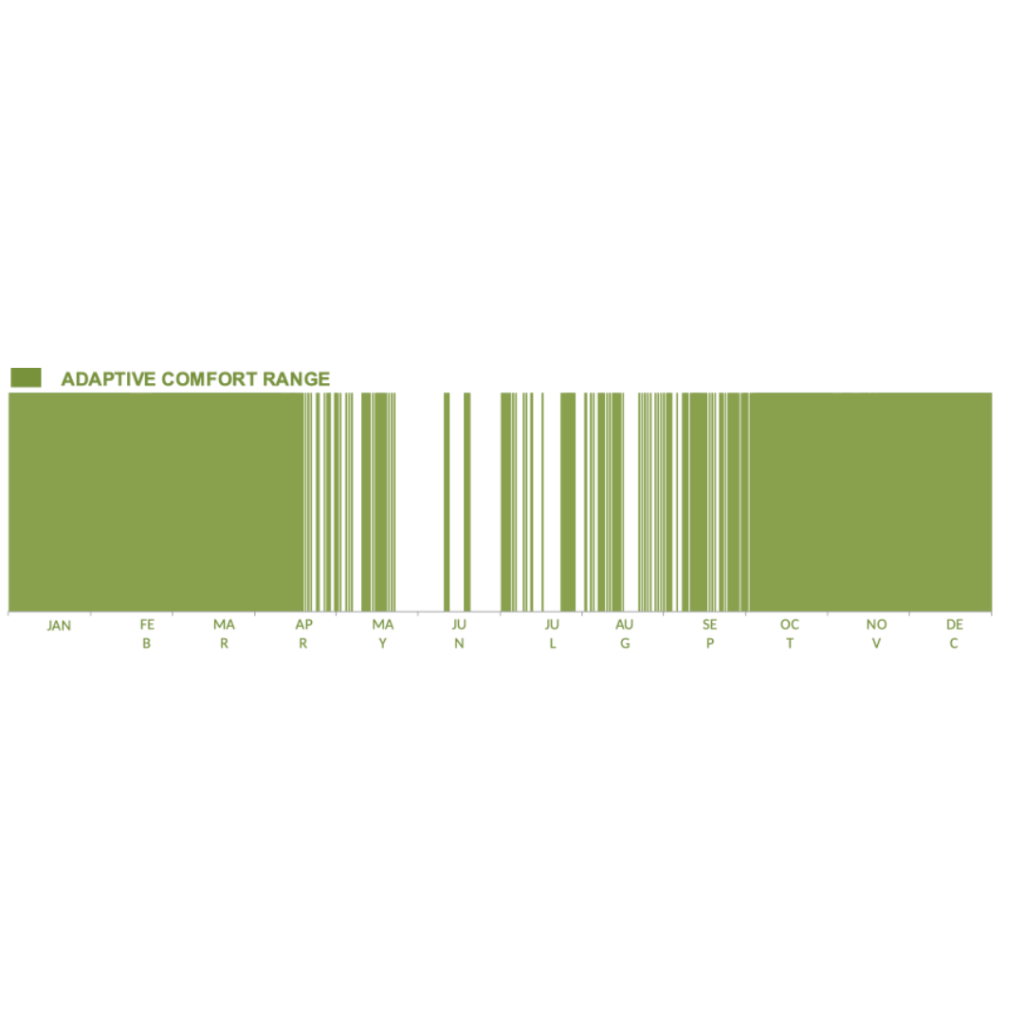
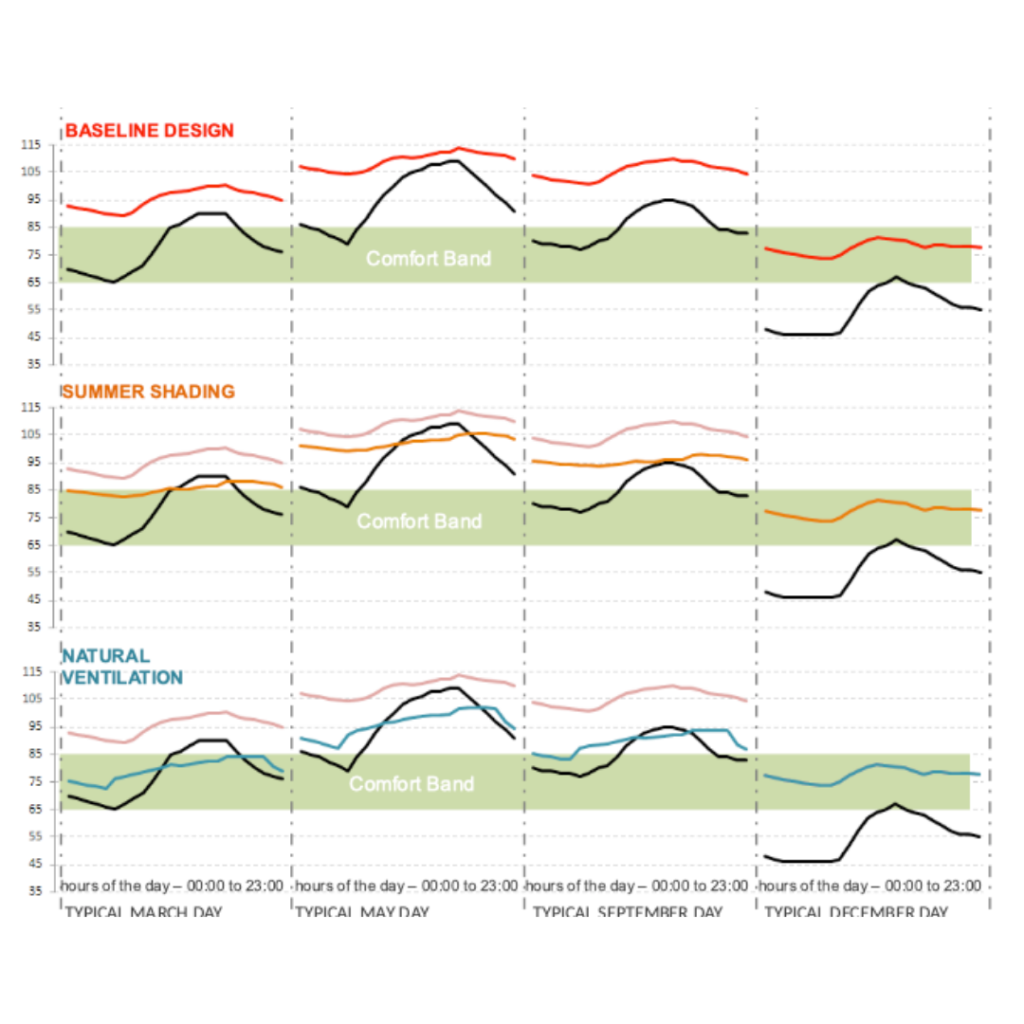
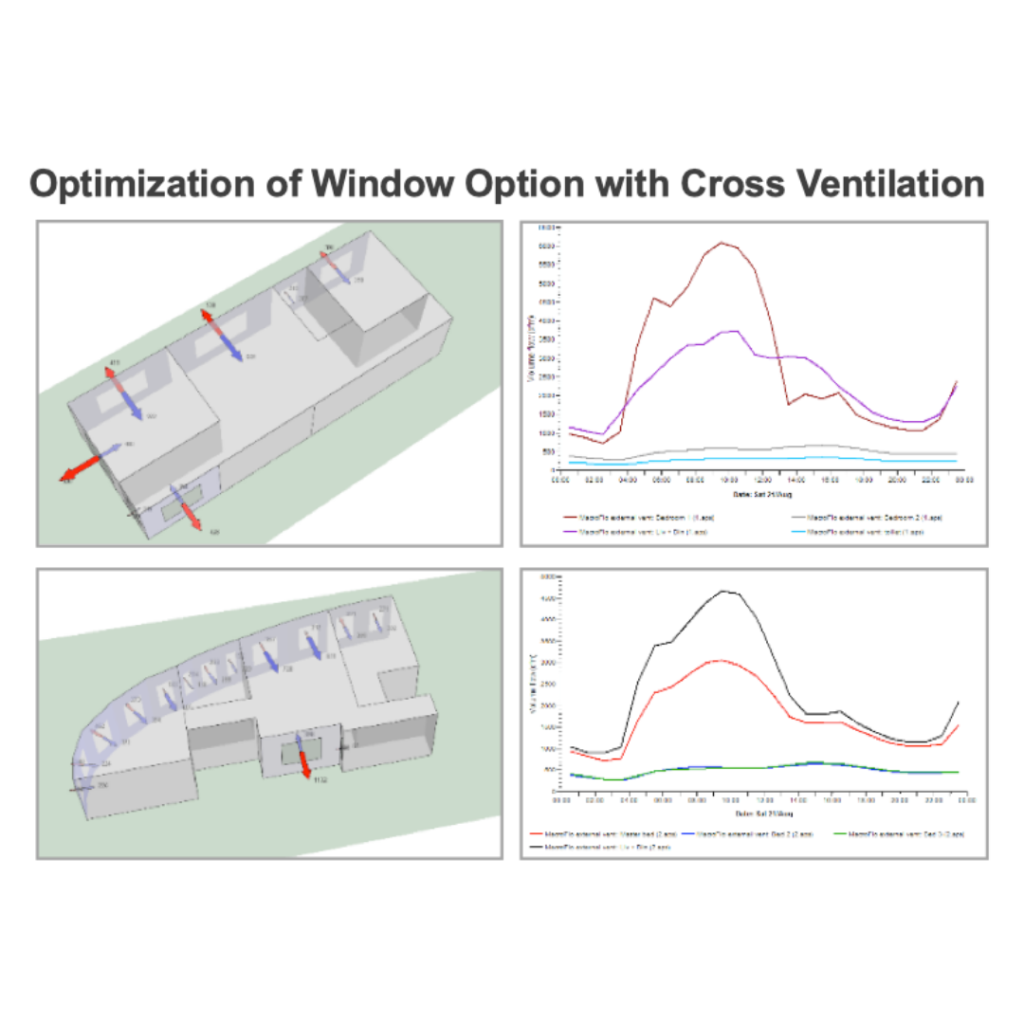
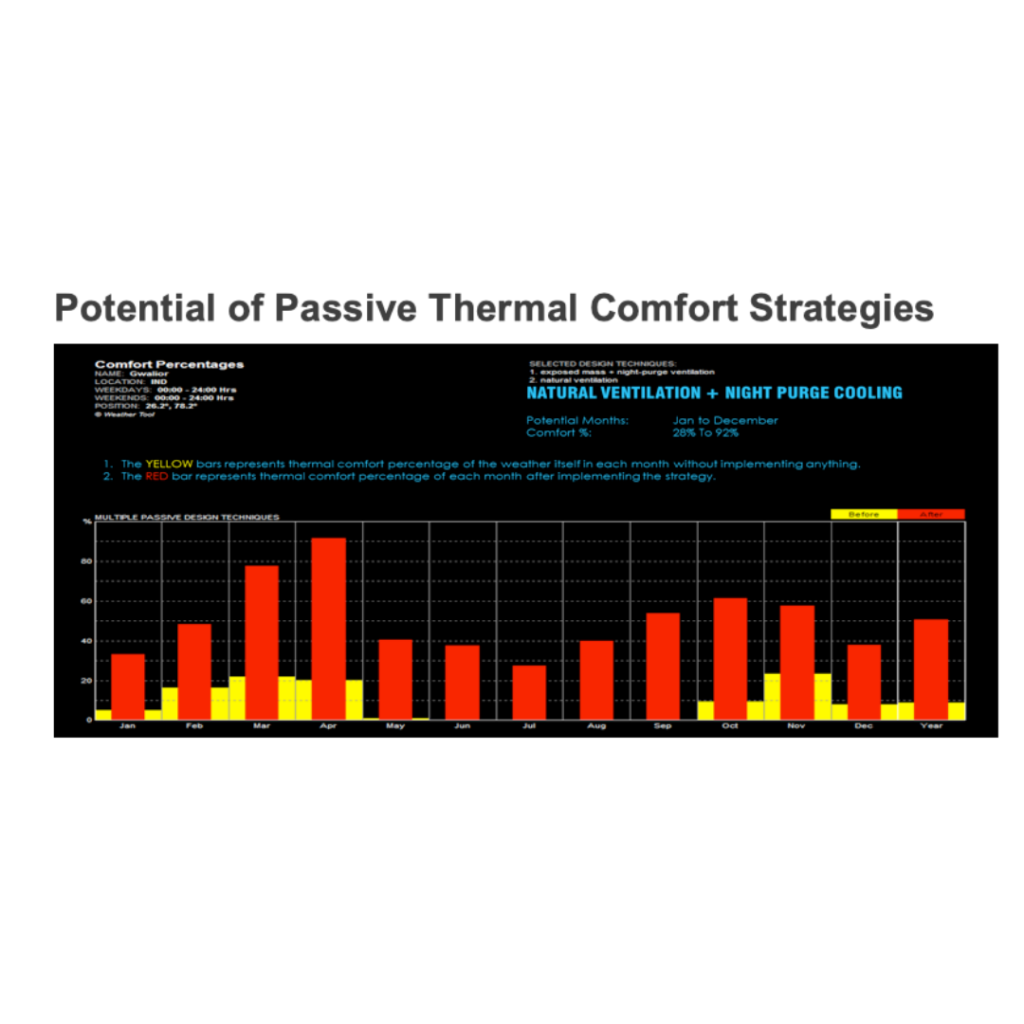
Natural Ventilation
The graphs on the right illustrate the inside space temperatures against outside air temperature on a typical day in each of the representative season months.
The white lines on the bottom chart are representing the temperature above 85F & green lines stand for temperature below 85F. As can be seen, using window shading & natural ventilation as solar passive strategies, out of total 8760 hours, more than 50% hrs are in adaptive comfort range & the building requires additional cooling only in the months of April through September.
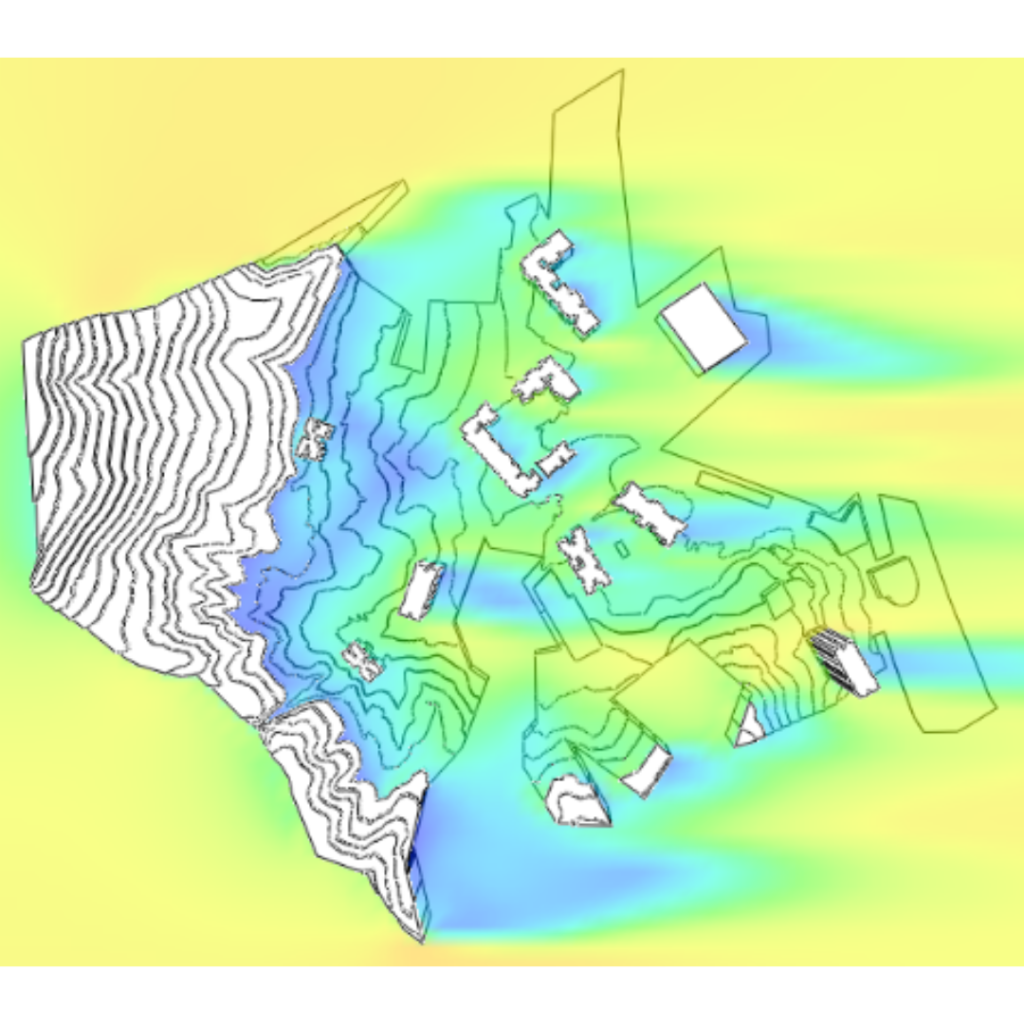
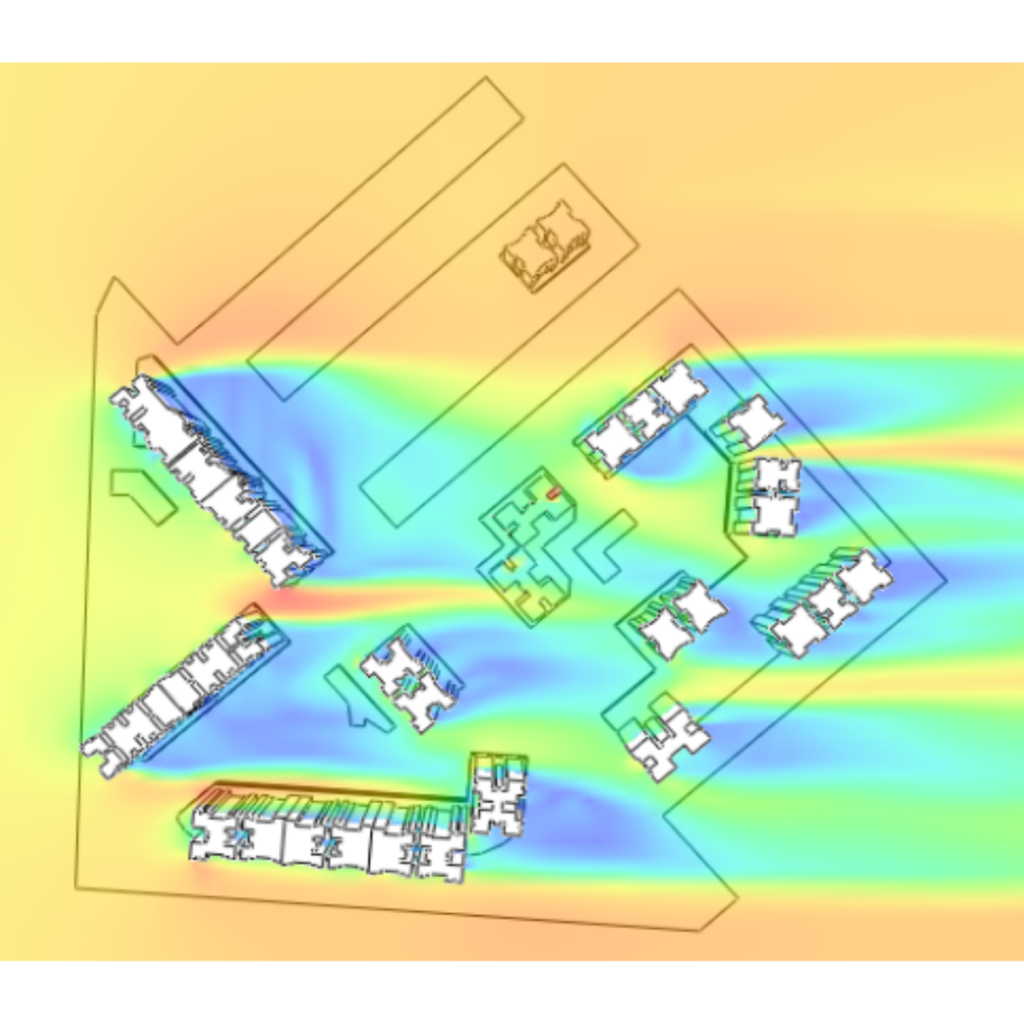
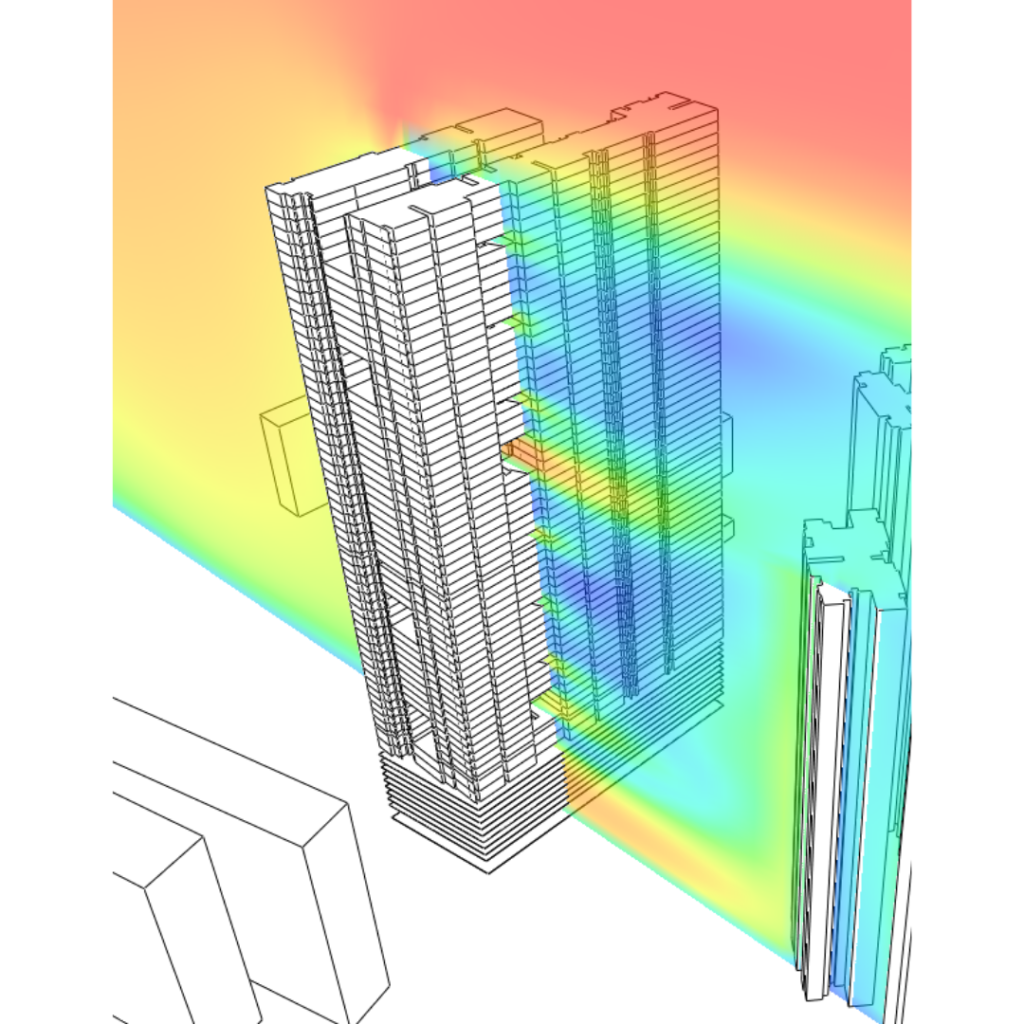
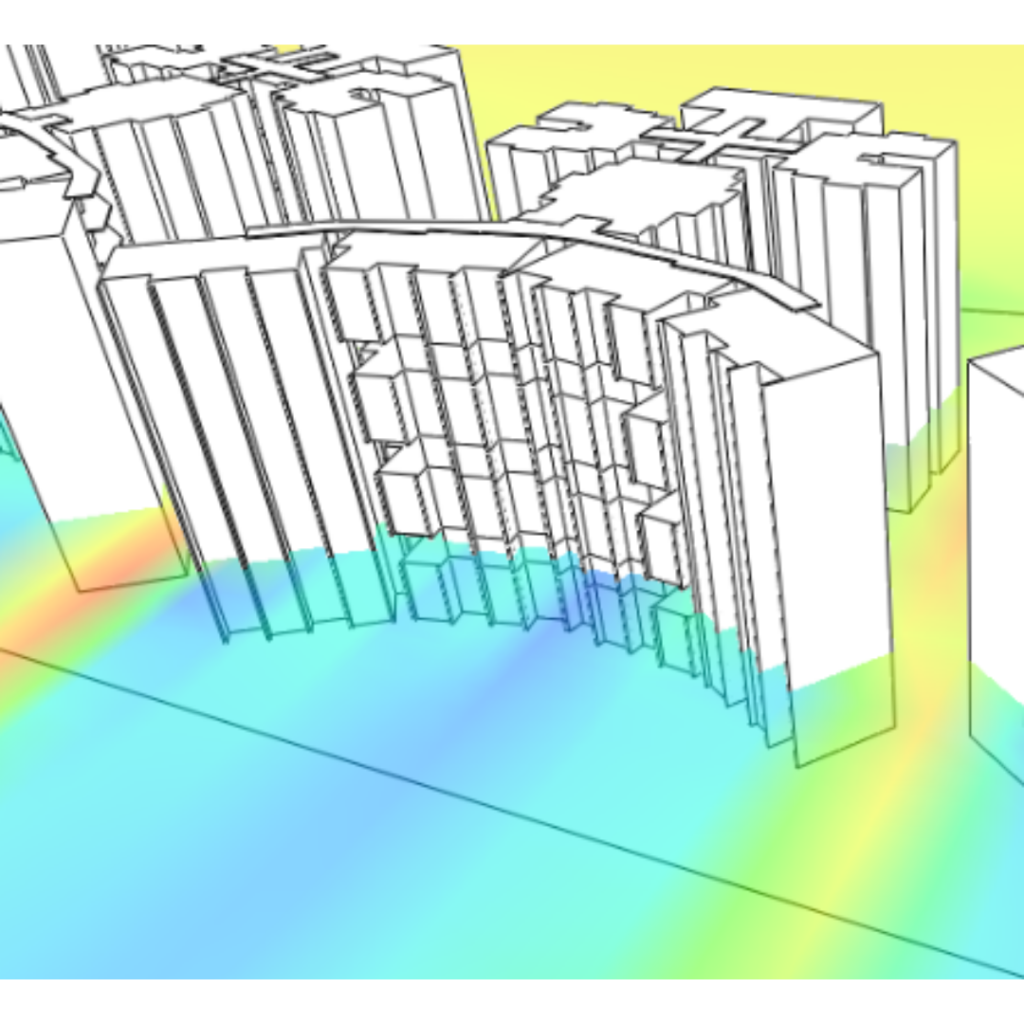
Wind Analysis
High Rise Buildings tends to change the wind flow patterns, thus reducing the wind velocities on the leeward side of the buildings. To reduce the wind shadow impact, multiple voids in the form of through and through cut outs were proposed in the building façade to allow the fresh breeze to pass through the building without affecting the wind flow around the neighborhood buildings.
The images above shows CFD simulation of a University Residential Building in which voids are created on the 3rd,6th and 9th floor of the building to allow the fresh air to pass through it, thus reducing the vortices forming on the leeward side of the building.
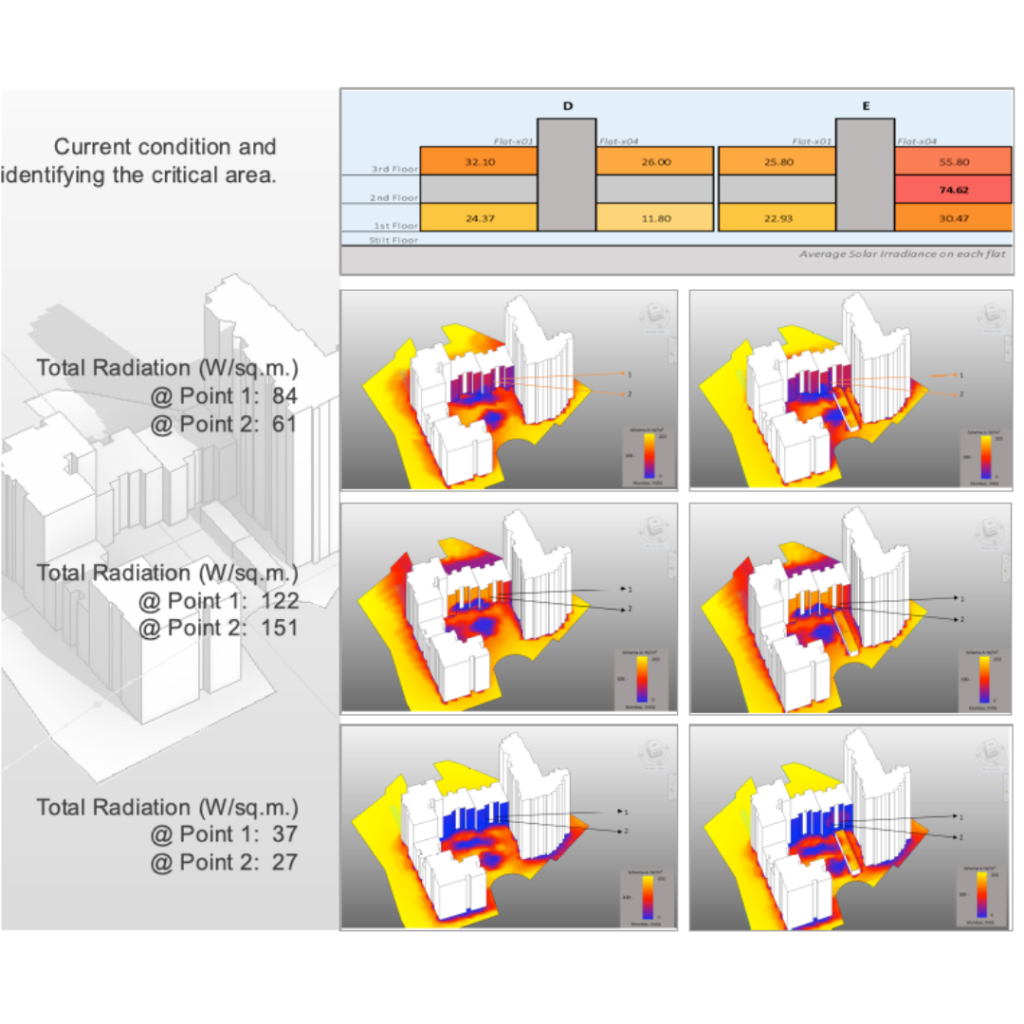
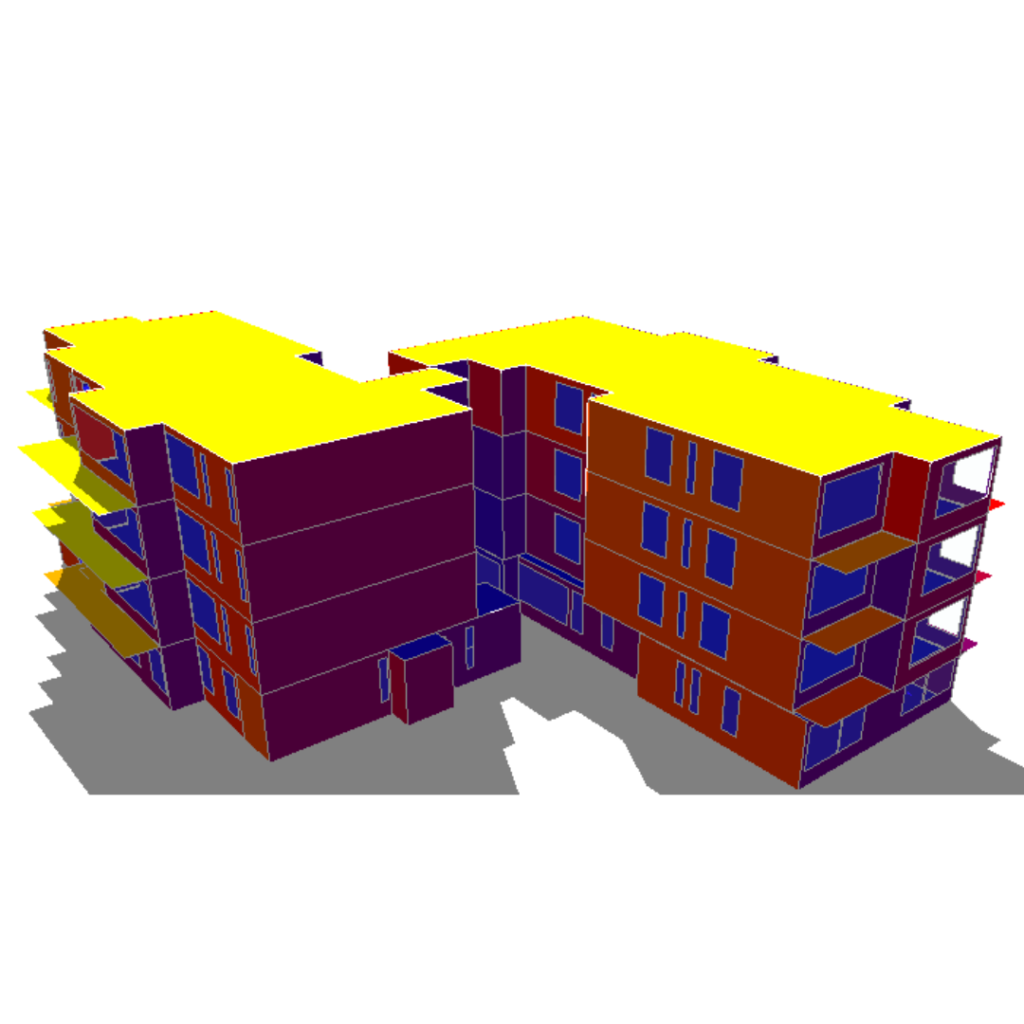
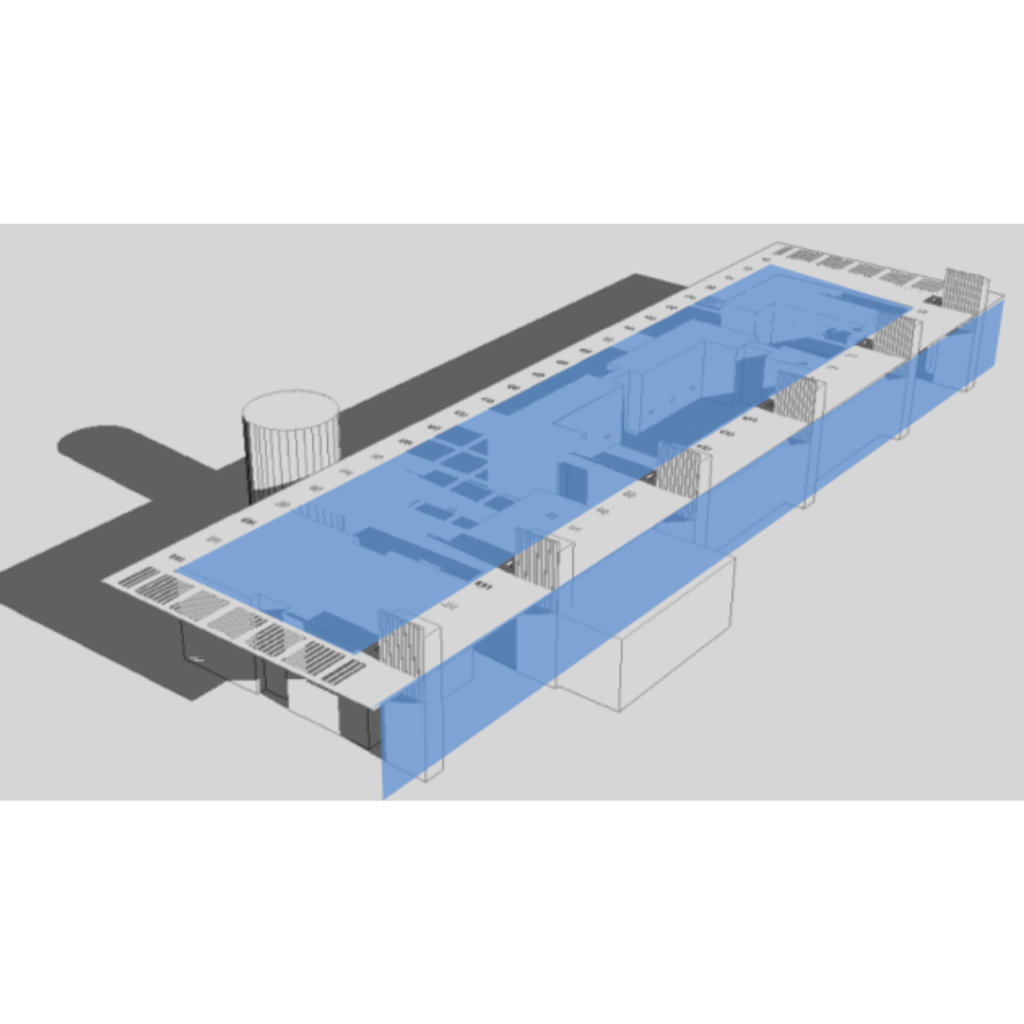
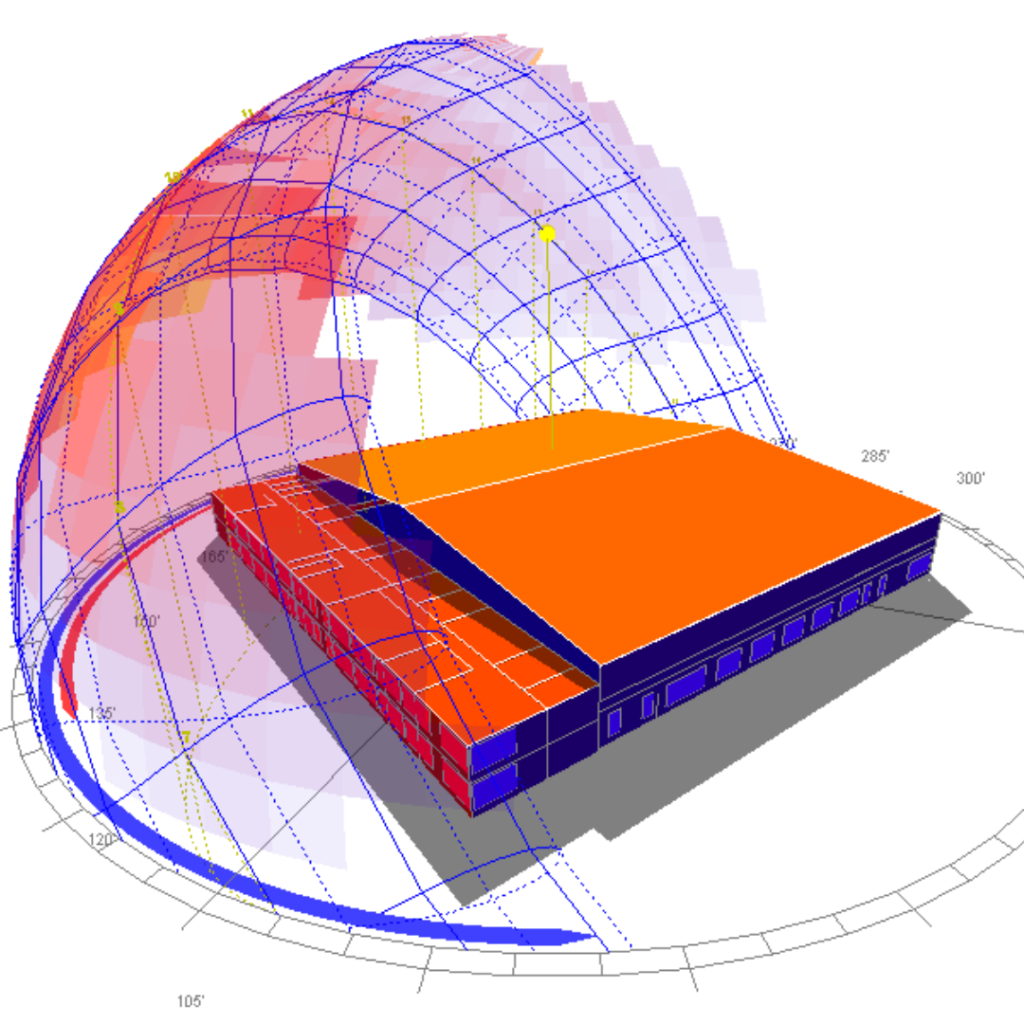
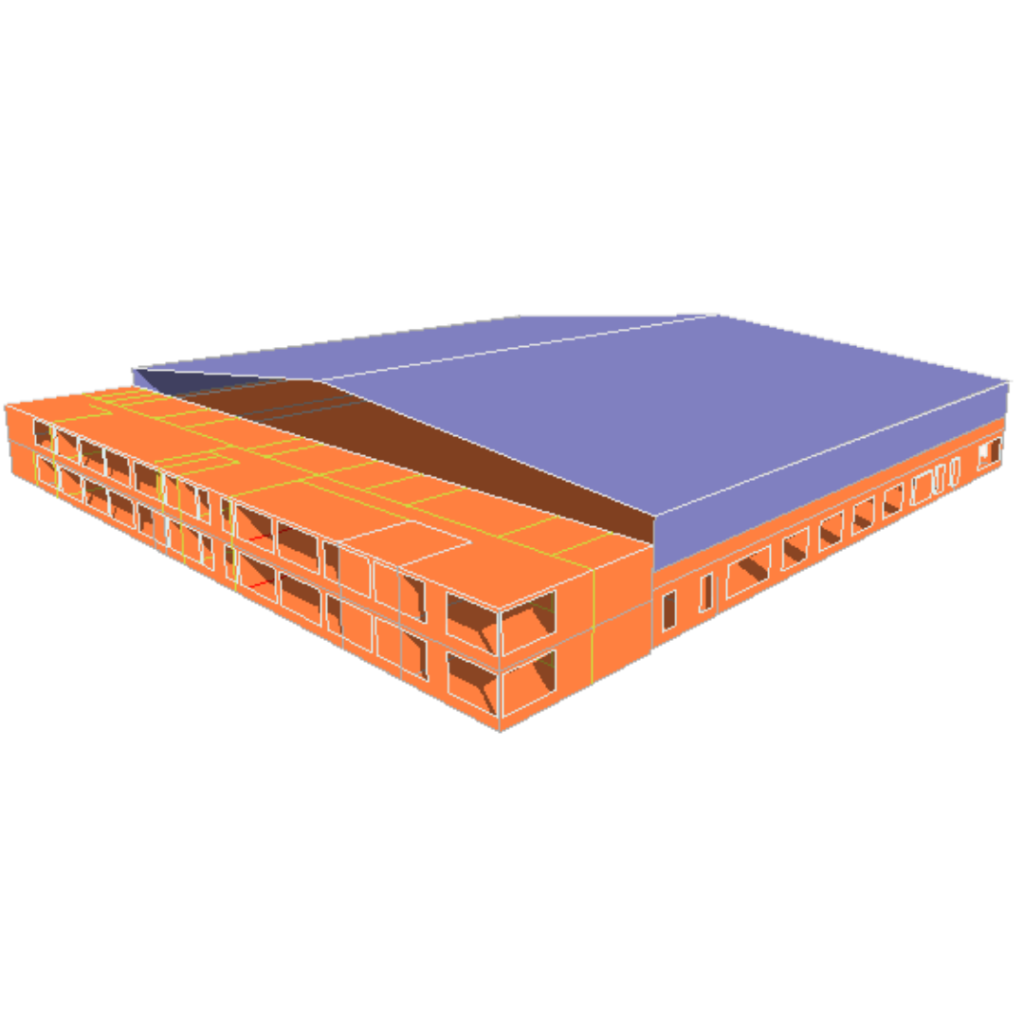
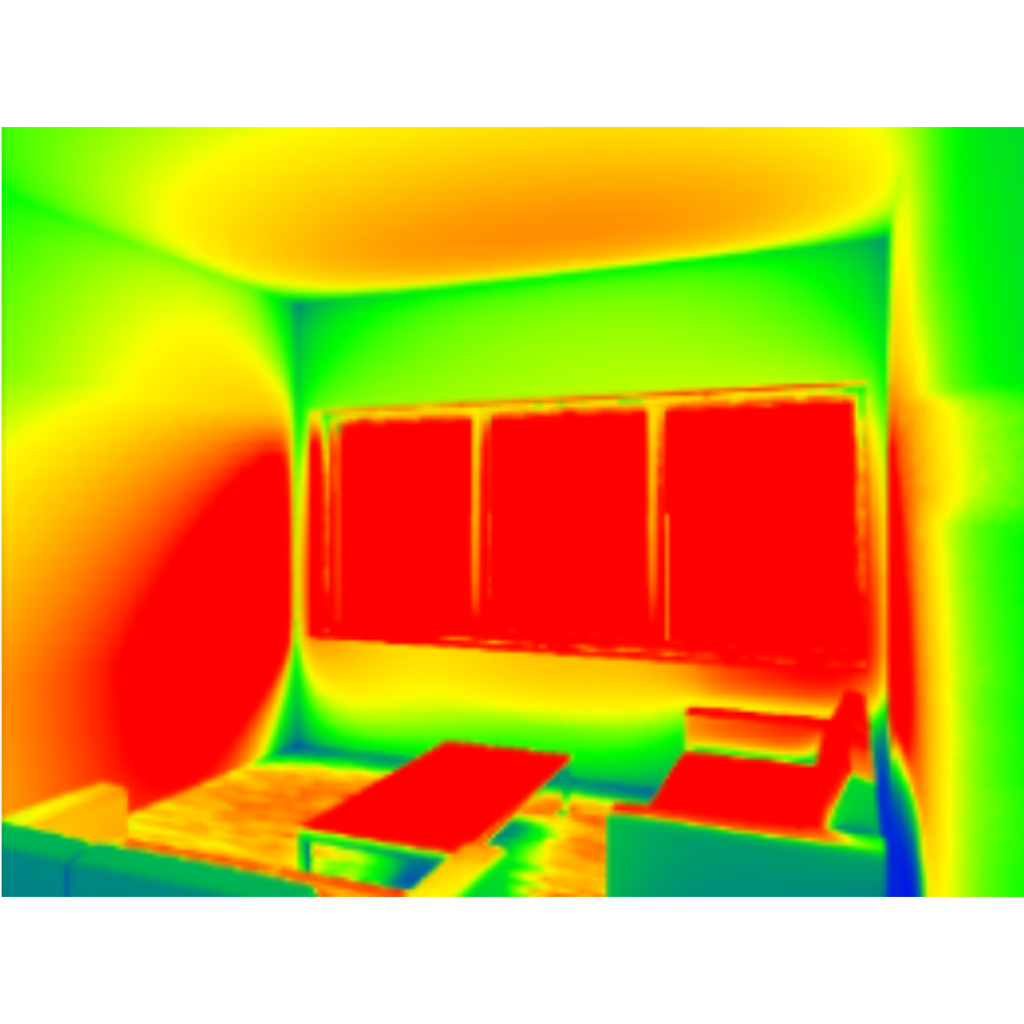
Radiation Analysis
Solar irradiance has been measured in Wing D and Wing E at window of each space and at the centre of each room, and for two different time period i.e. at 12:00 noon and at 3:00 PM.
Study Data
- 21st March – The Equinox day when the altitude of sun is neither lower nor higher
- 21st December – The Winter Solstice day when the altitude of sun is the lowest and sun penetrates highest on south facade.
- 21st June – The Summer Solstice day when the altitude of sun is the highest and sun penetrates with the lowest on south facade


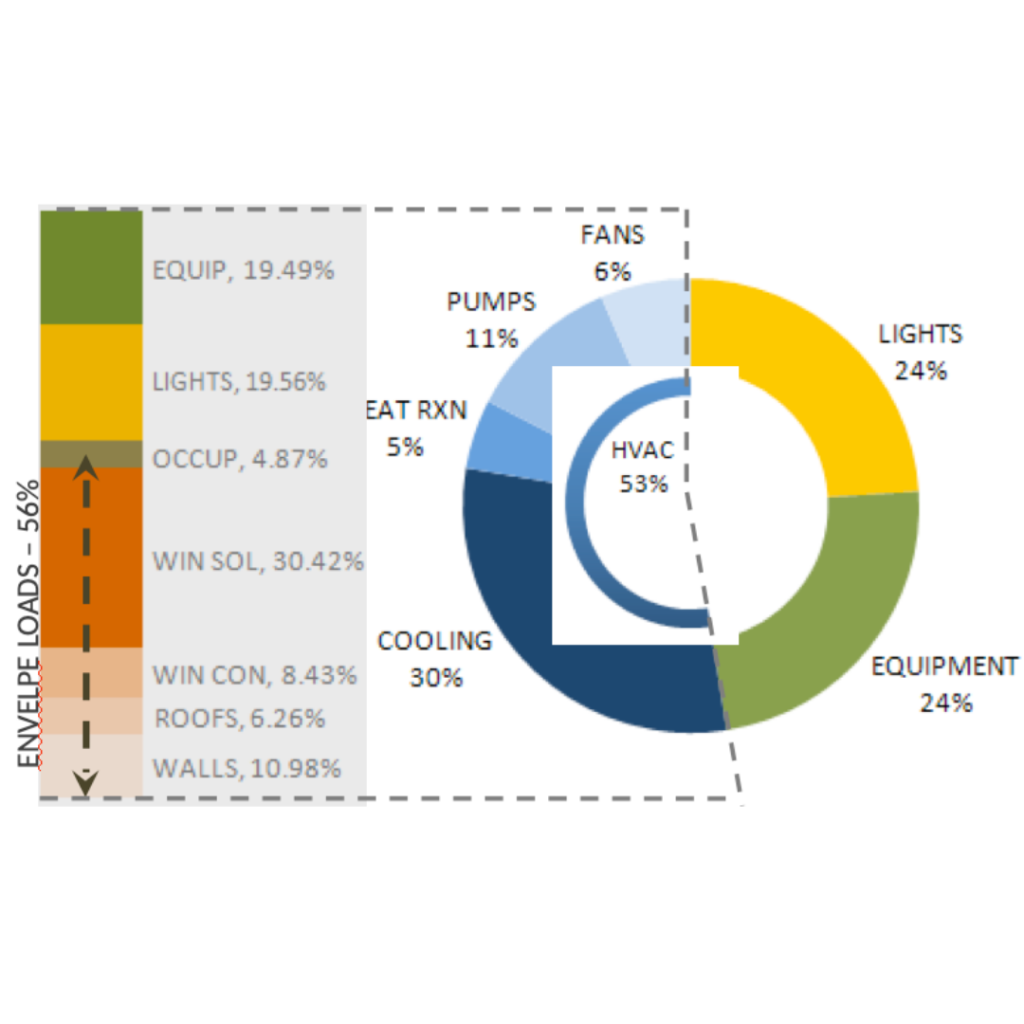
Envelope Optimisation
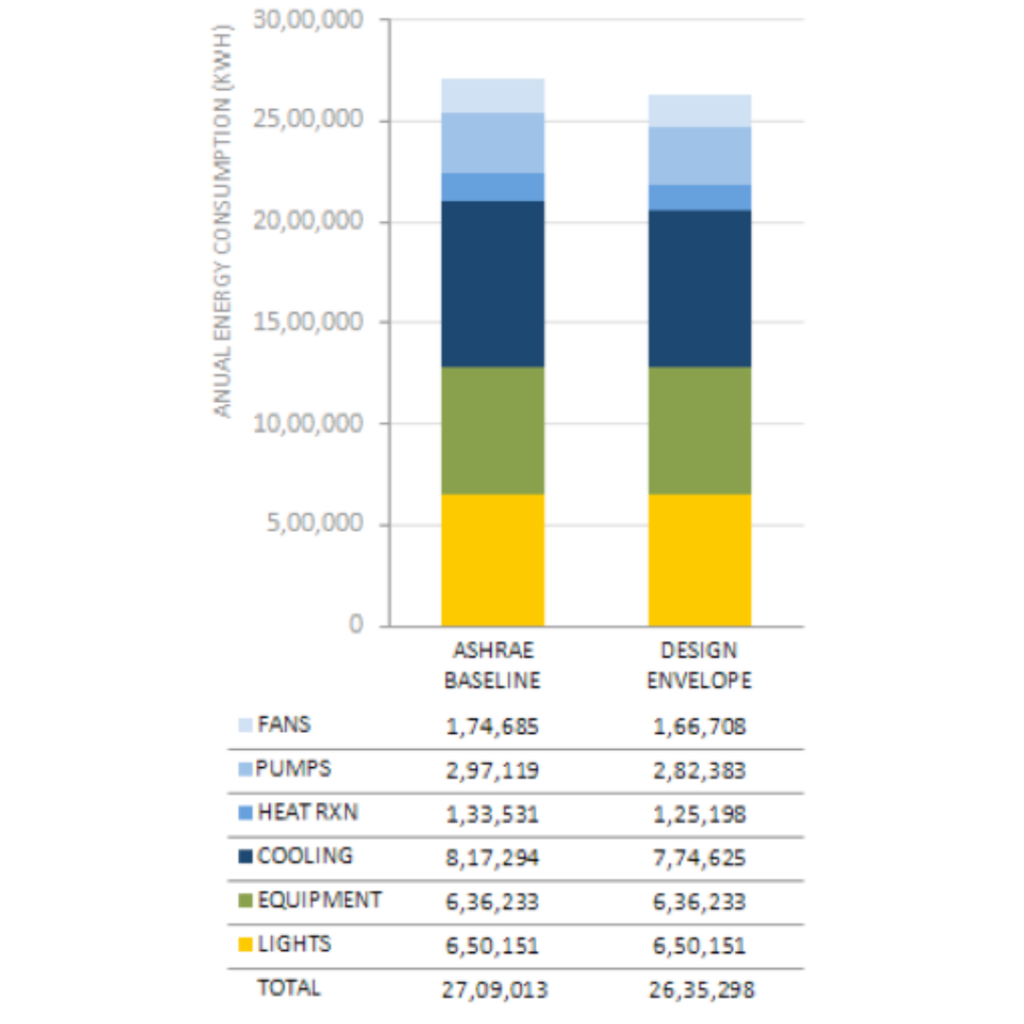
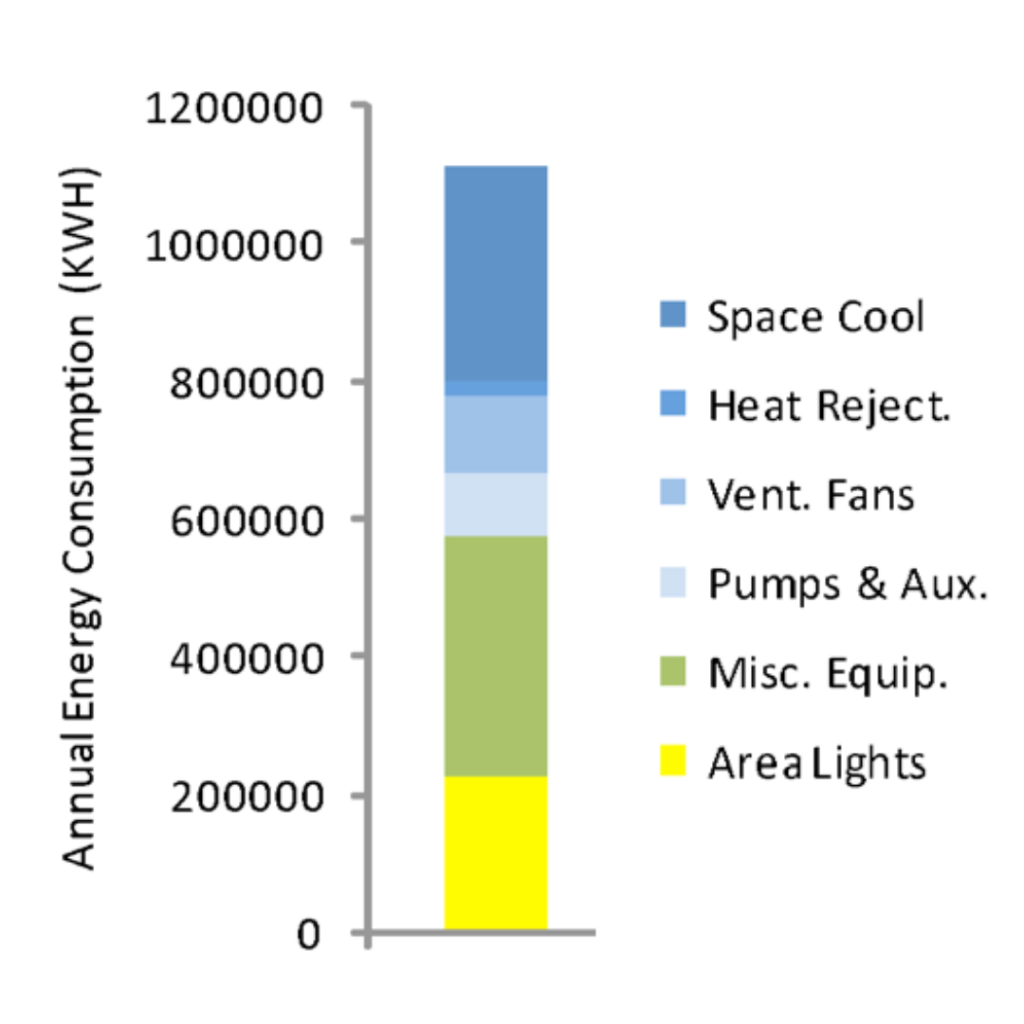
The chart on the left presents the annual energy use breakdown by end use and illustrates that half of the building energy is consumed by HVAC end uses comprising of Cooling, Heat Rejection, Pumping and Ventilation Fans.
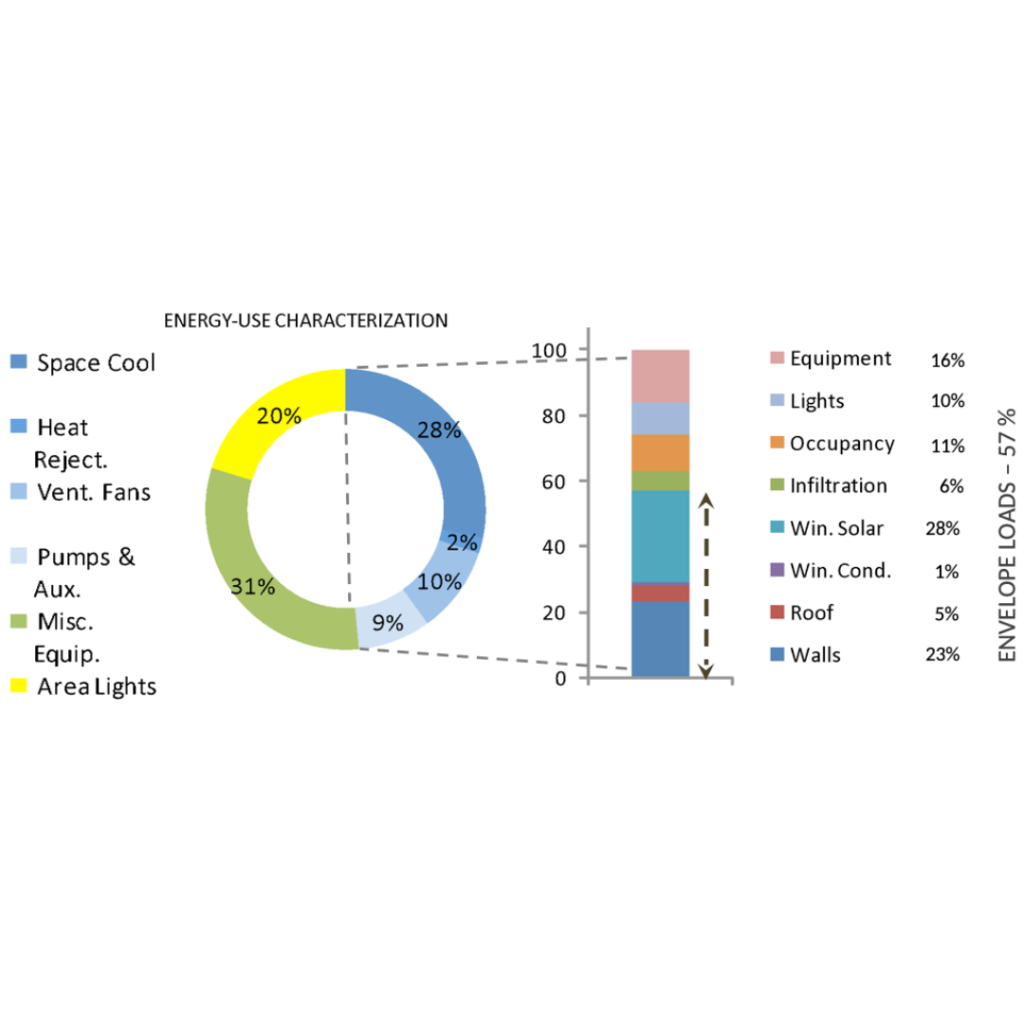
Further Cooling load breakdown, as shown above, also suggests that 56% of the cooling load in the project is directly affected by the design of the building envelope. The rest is caused by heat gain from internal loads such as lighting and equipment.
Façade Designing
The chart on the left presents the annual energy use breakdown by end use and illustrates that half of the building energy is consumed by HVAC end uses comprising of Cooling, Heat Rejection, Pumping and Ventilation Fans.
Further Cooling load breakdown, as shown below, also suggests that 57% of the cooling load in the project is directly affected by the design of the building envelope. The rest is caused by heat gain from internal loads such as lighting and equipment.
- Climatic Analysis shows that Bangalore city has a temperate climate with less diurnal change in the temperature between inside & outside.
- Energy analysis & Simulation report presents that, HVAC loads due to window conduction is just 1% & window solar is contributing upto 28% of the total HVAC loads.
- It is recommended that in the glass selection, lower S.C. or S.H.G.C. should be given preference than the ‘U’ Value of the glass.
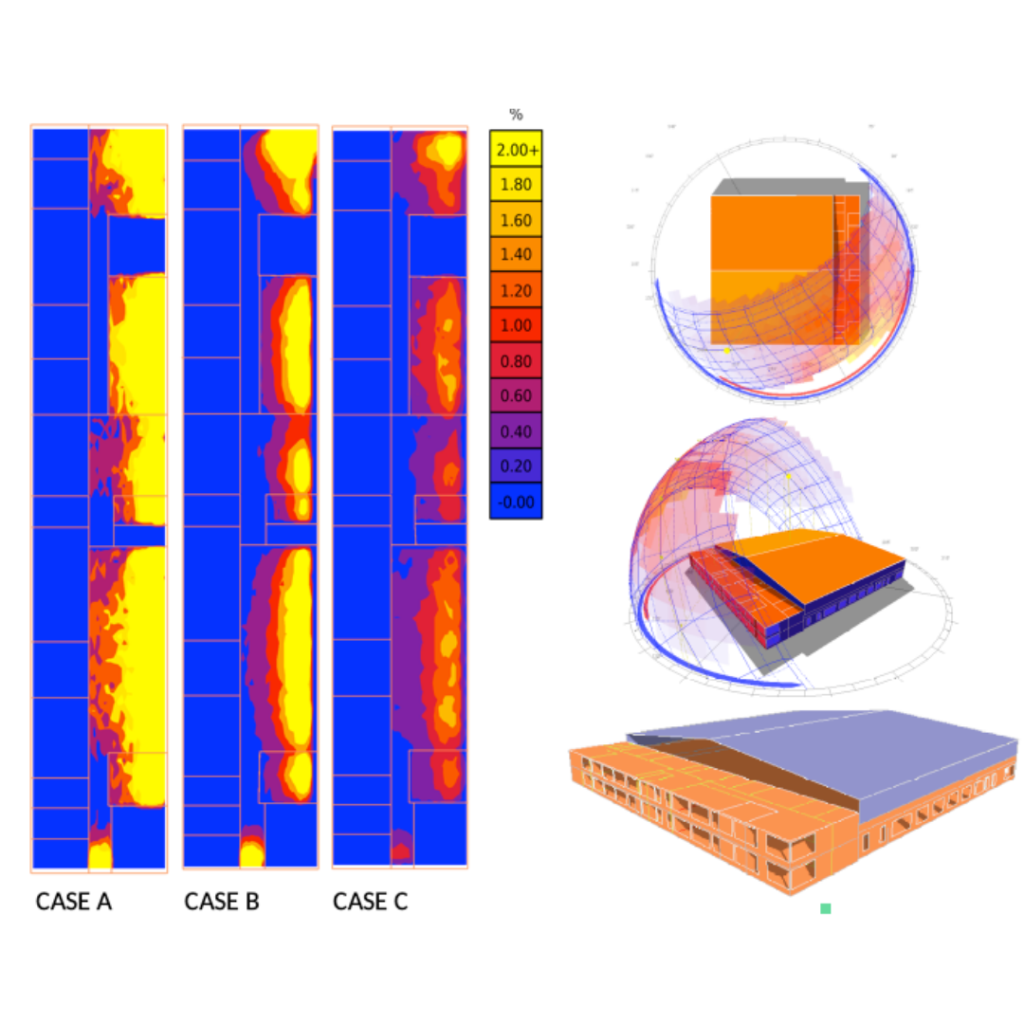
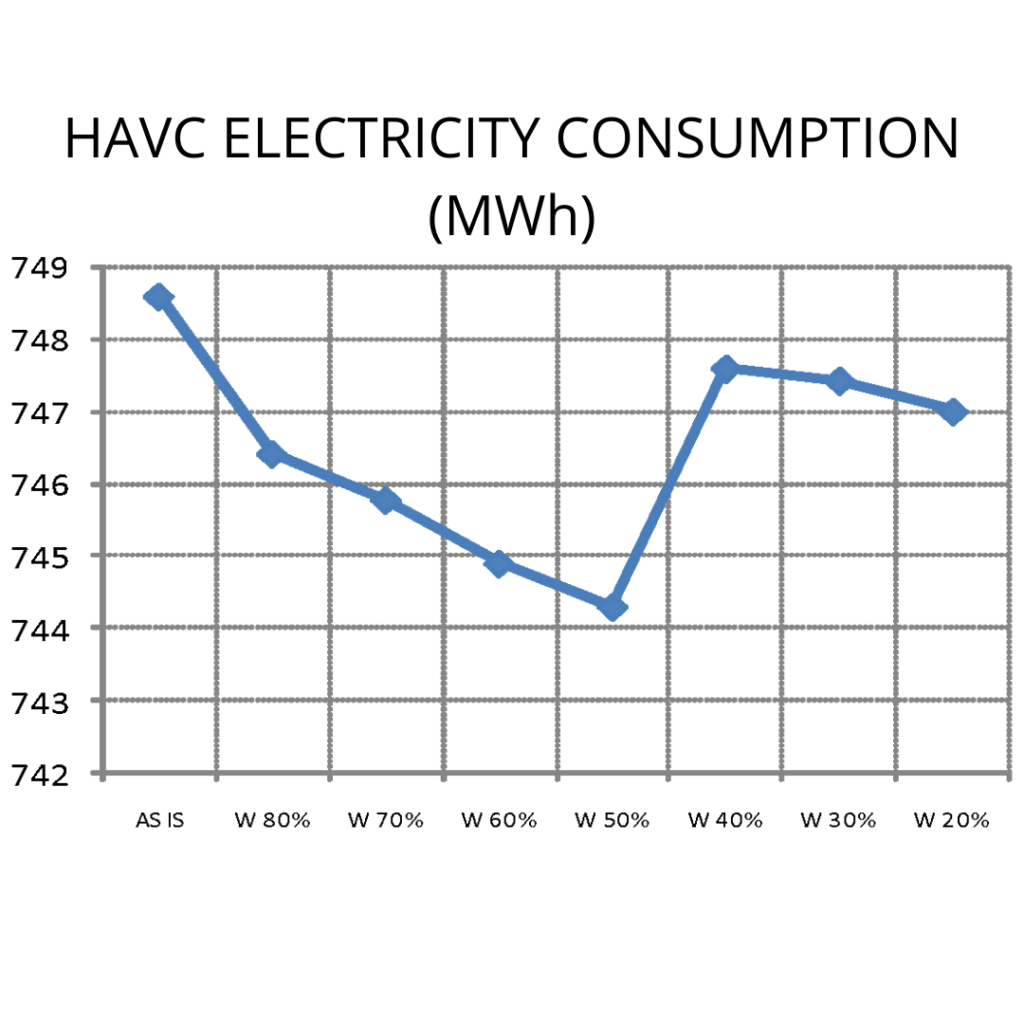
WWR Optimisation
The chart on the left presents the annual energy use breakdown by end use and illustrates that half of the building energy is consumed by HVAC end uses comprising of Cooling, Heat Rejection, Pumping and Ventilation Fans.
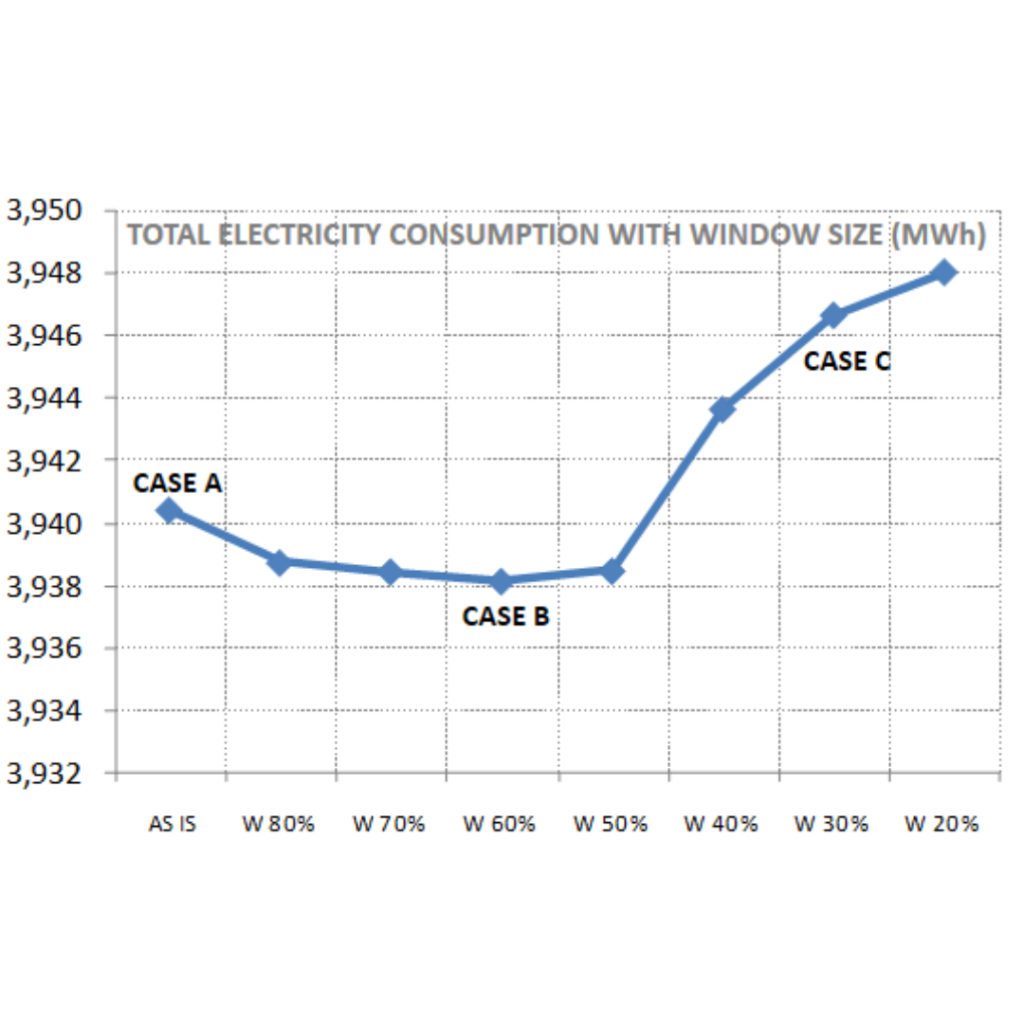
Case A: “As-Is” window size
Case B: Window size reduced to 60% of “as-is”
Case C: Window size reduced to 30% of “as-is”
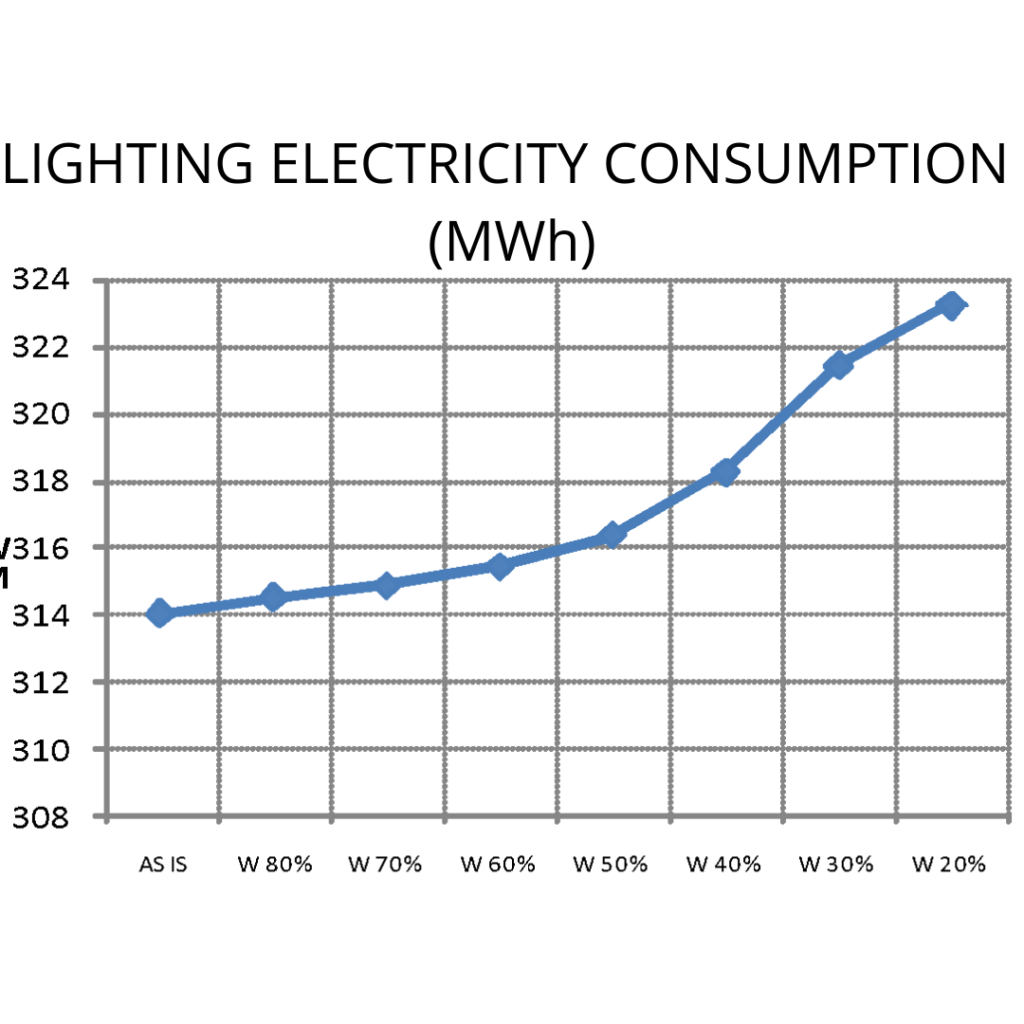
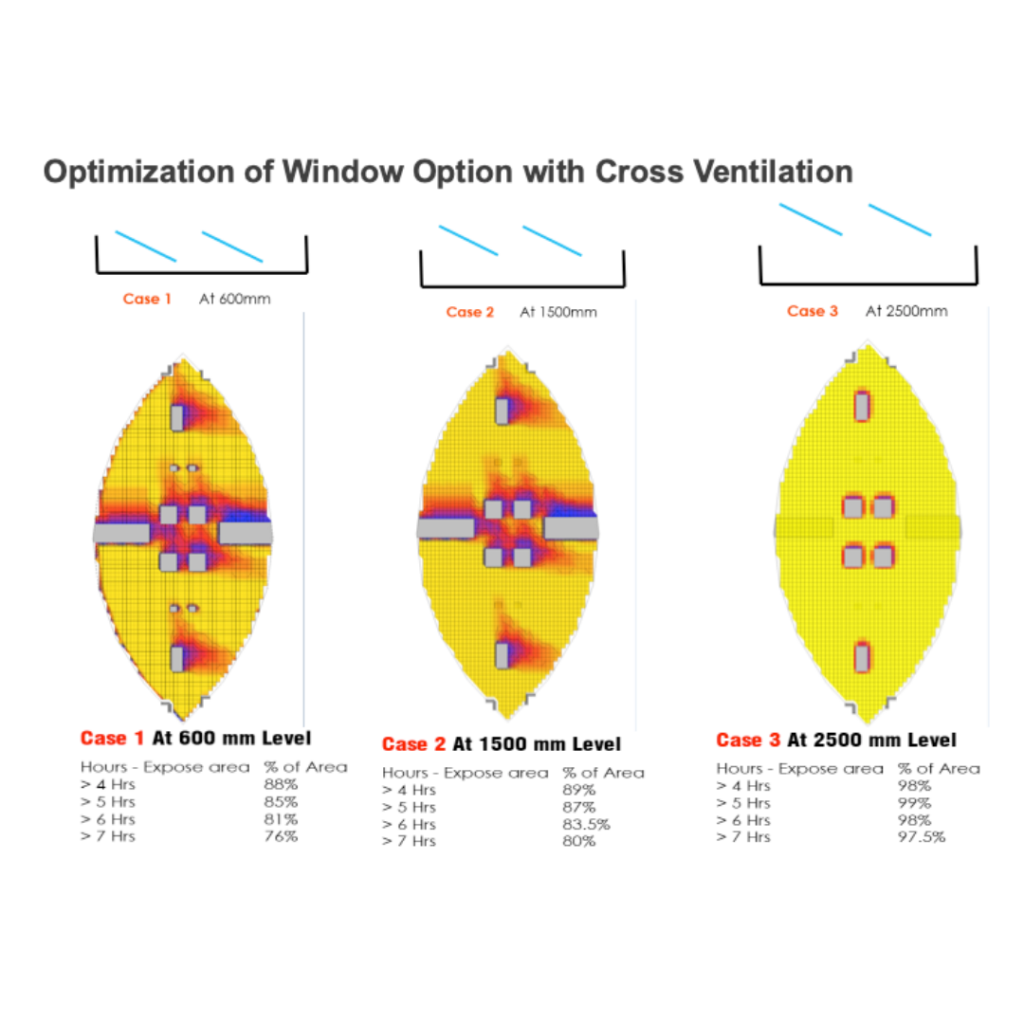
The graphs on the right illustrate the optimization analysis for appropriate window widths. As can be seen, as window size is reduced daylight levels reduces resulting in increased lighting consumption. Although there is a reduction in thermal losses with reduced windows, there is an increase in cooling energy because of the lighting associated heat gains.
It was found that at window widths equal to 60% of the original size, there is minimum total energy consumption along with comfortable day light levels inside. Based on this analysis, the “As-Is” and Recommended elevations are drawn on the right.
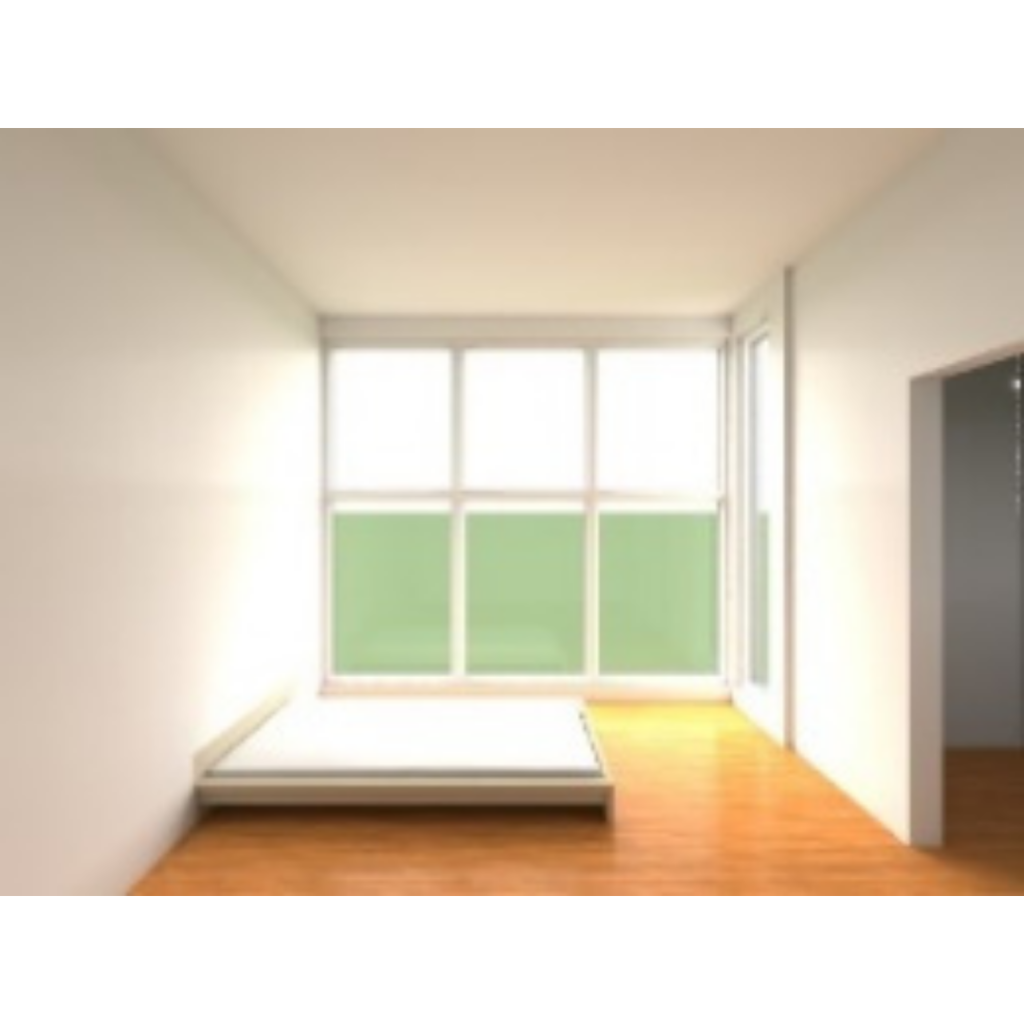
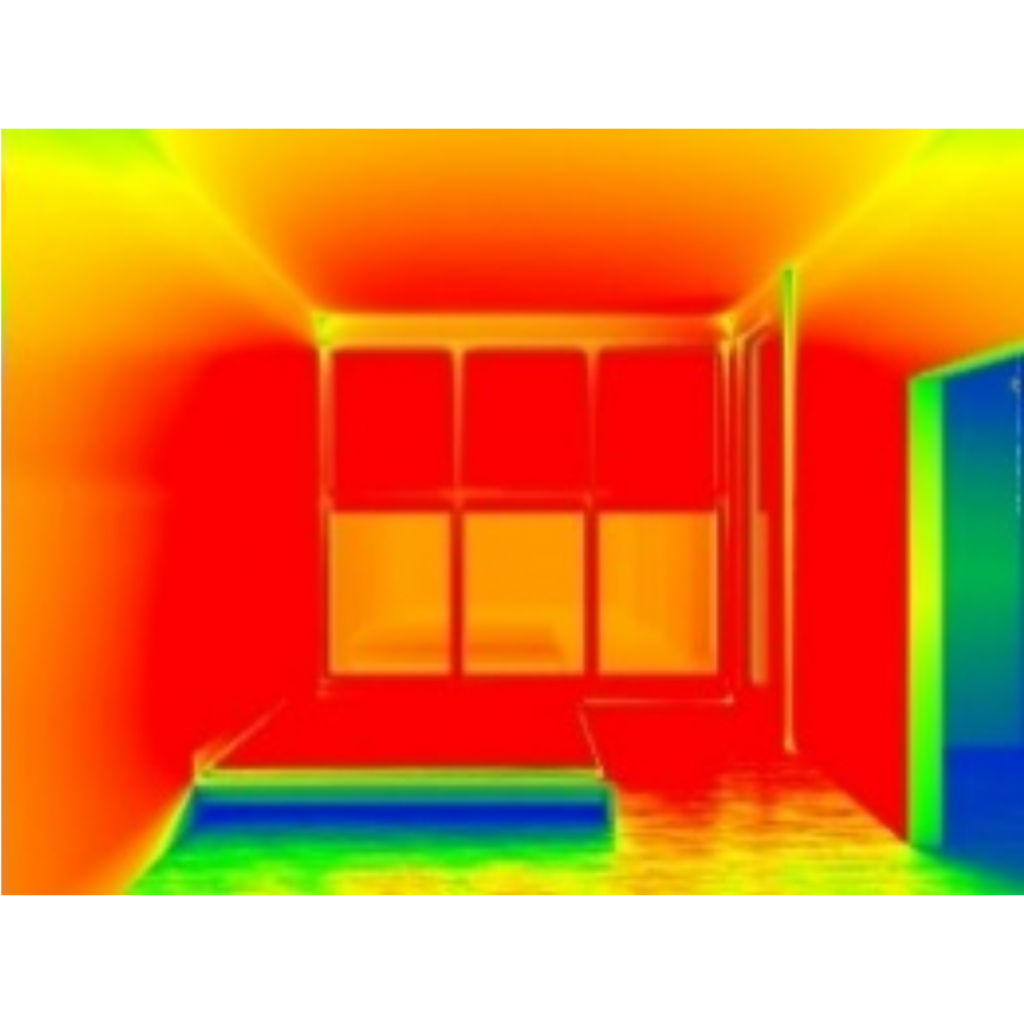
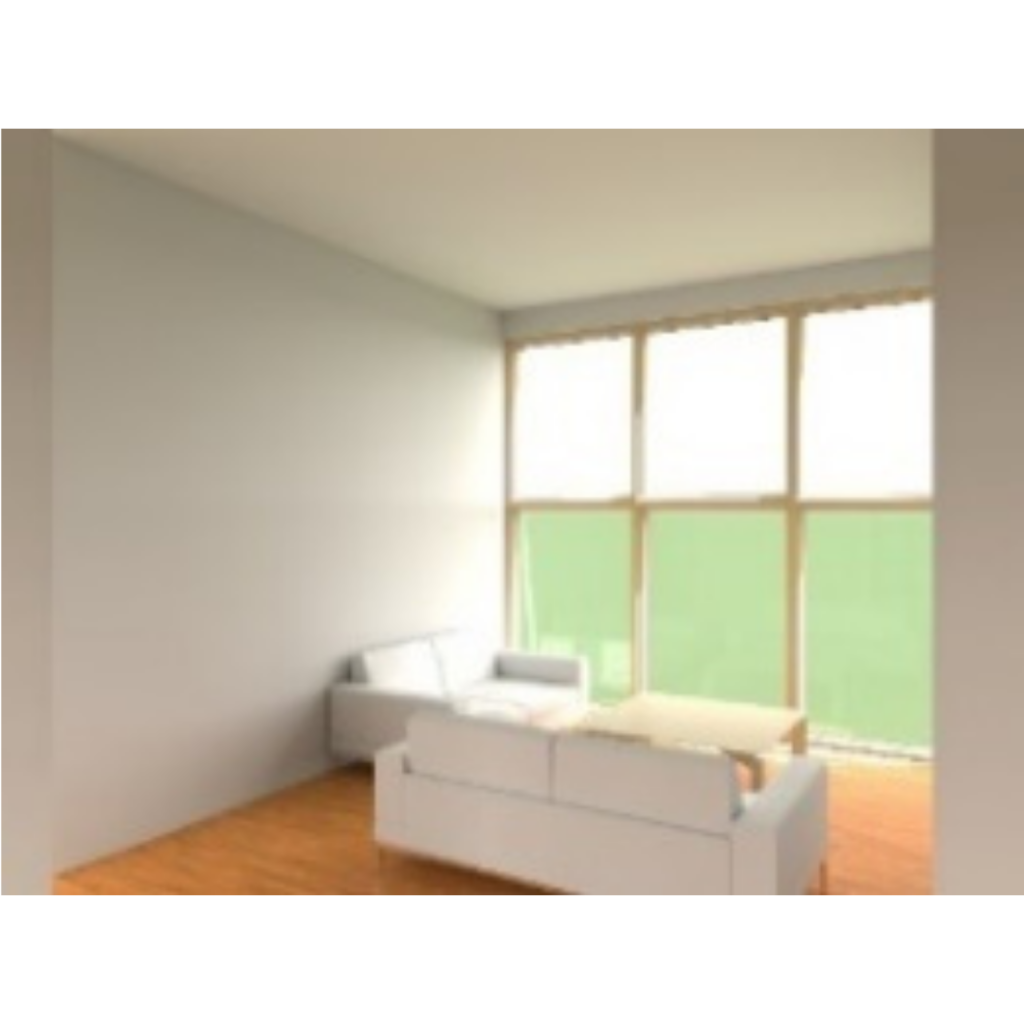
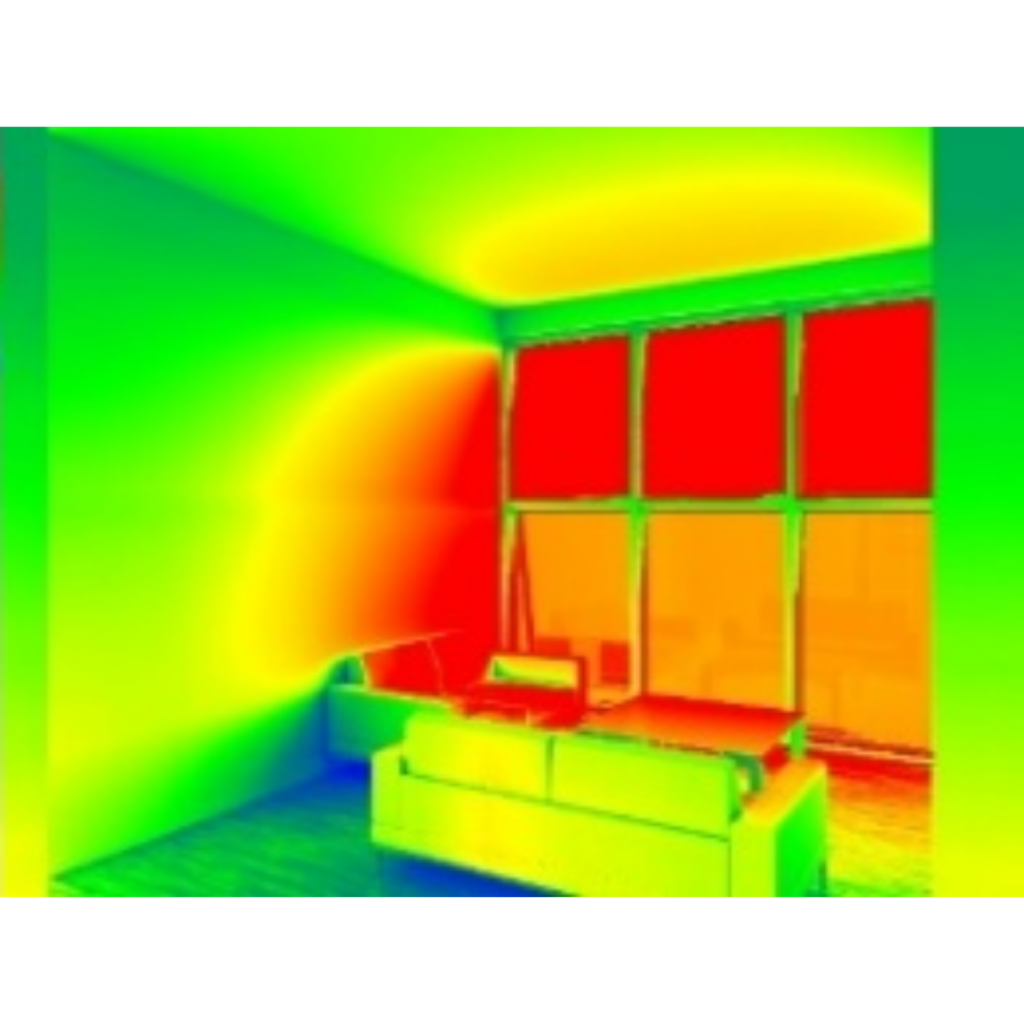
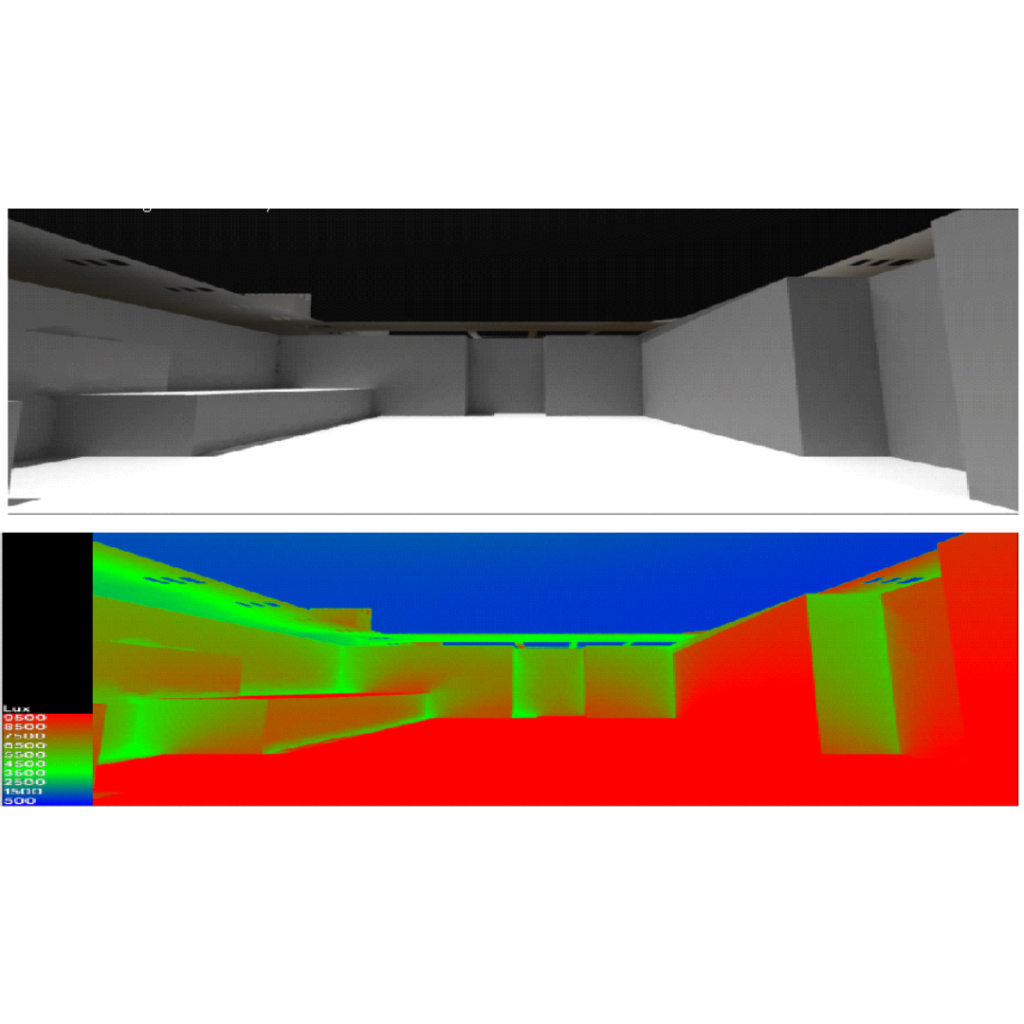
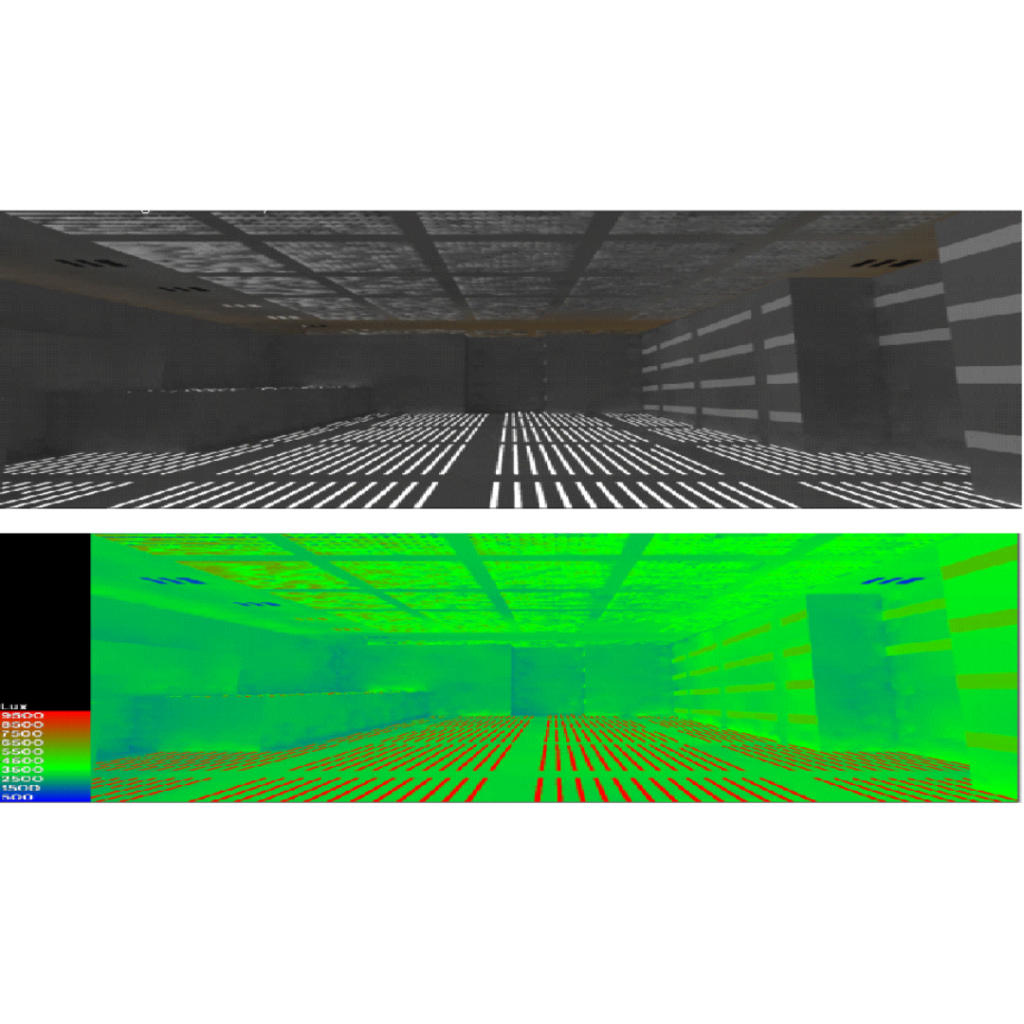
Daylight Analysis
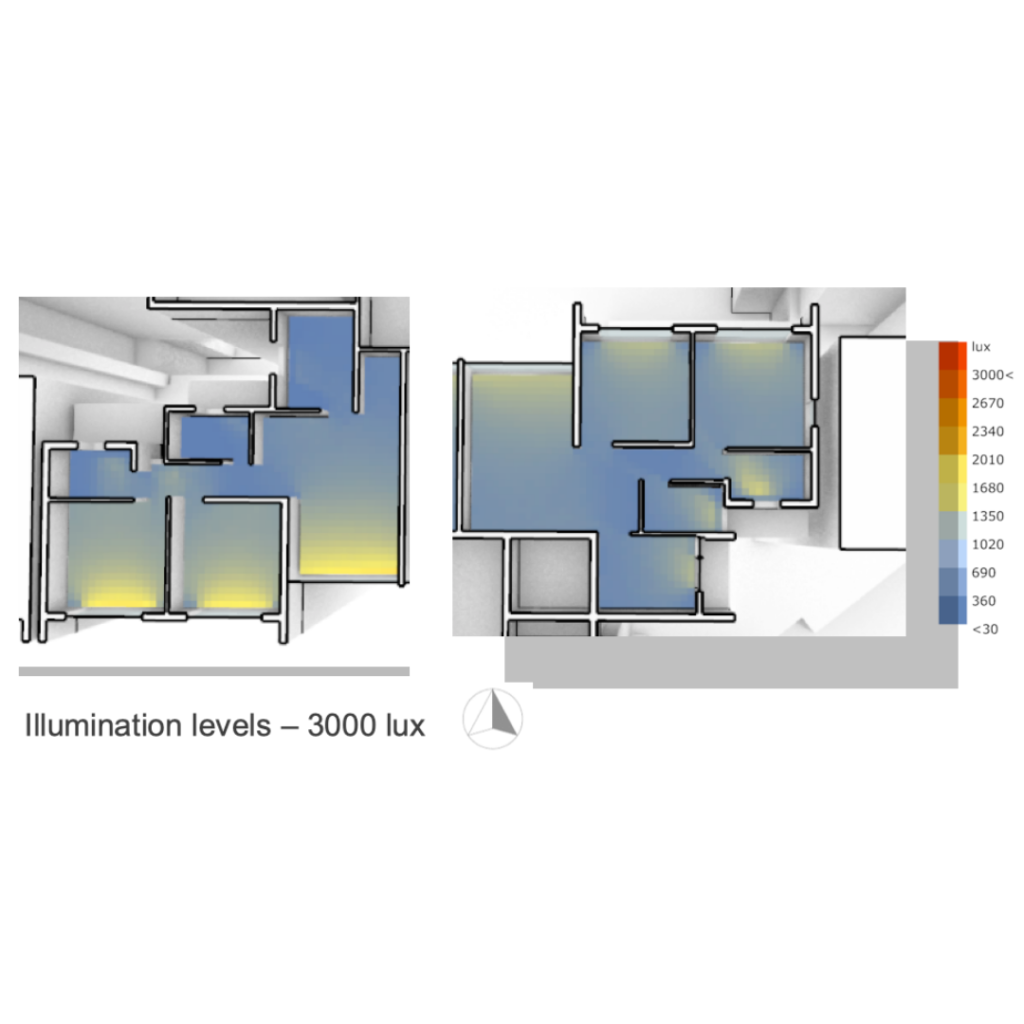
The illumination level’s study guides us to understand the daylight availability inside the space/room. The levels are tested for 3000 lux as benchmark range to identify the areas with excess amount of light which results in glare and over heating of the space.
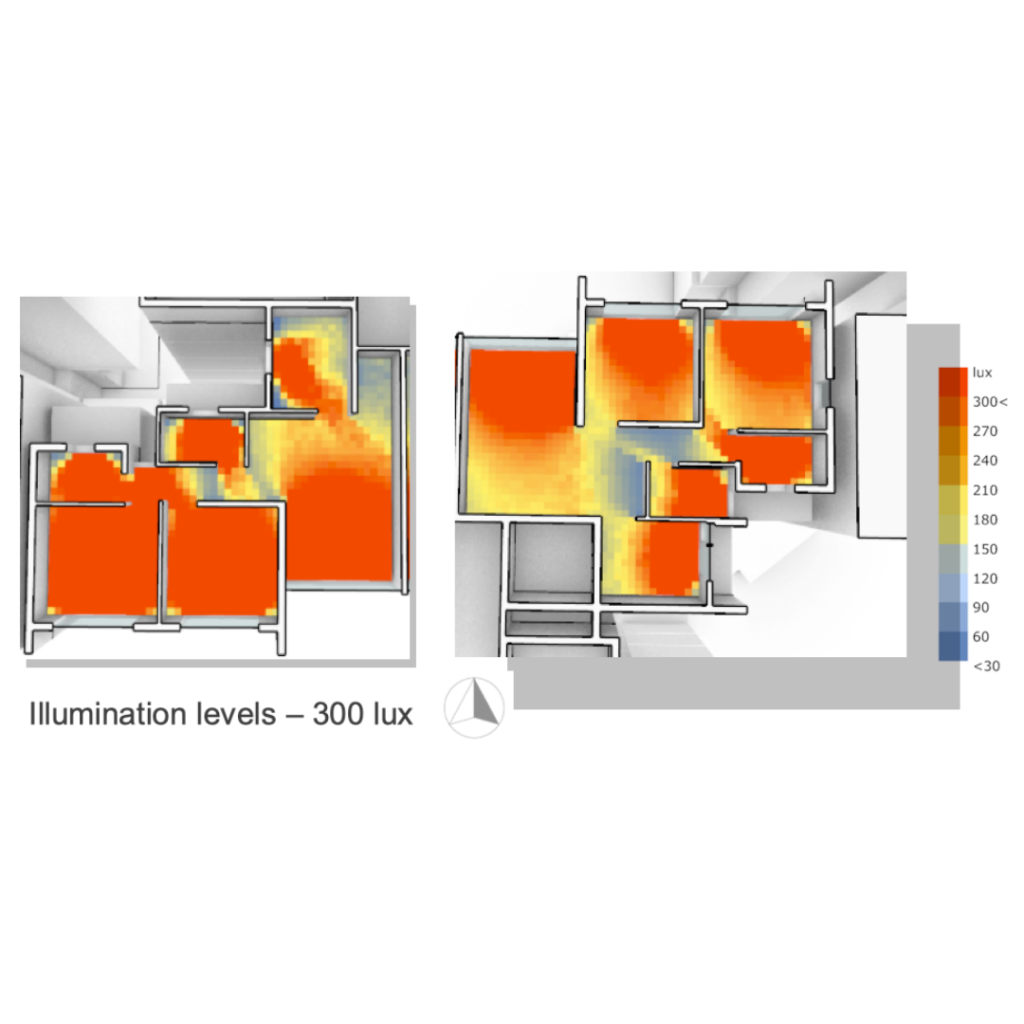
The secondary test for 300 lux level range gives us the idea of spaces with the required amount of daylight which is necessary for the actions to be undertaken in that particular space.
An holistic approach of the above two is necessary for understanding the daylighting requirements of a space
Glare Analysis
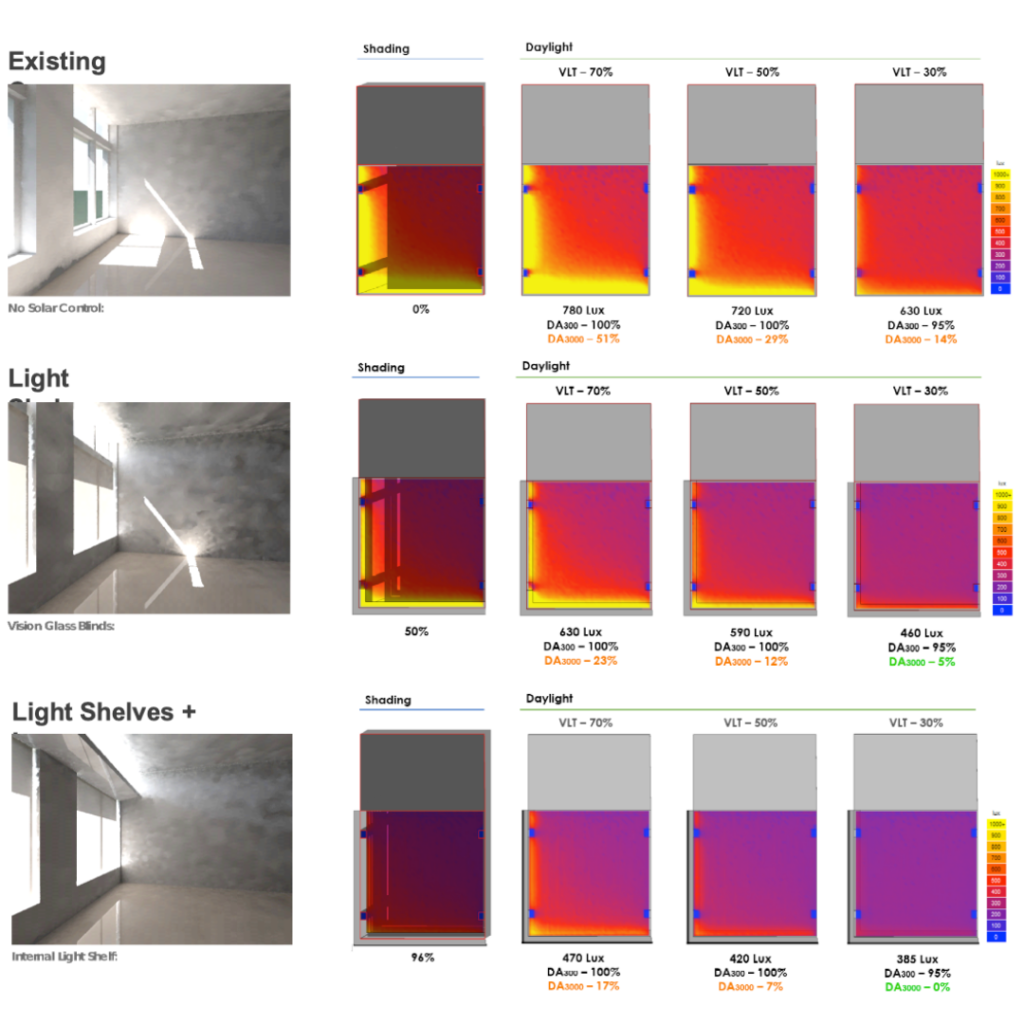
Daylight & Shading Design
The existing case – as per design and typical floor – is analysed first to understand existing daylight and window shading condition.
A light shelf has been introduced at lintel level i.e at 2,100 mm. The light shelf partially shade the fenestration below, and it also reflects indirect sunlight at deeper areas. As a result, it helps to increase diffuse daylight at those area
Louvers with height of 750mm, has been placed in front of glazing. The height is optimum to obstruct direct sun penetration on the fenestration. After putting them, the height of glass with clear vision (without obstruction) is 600 mm.
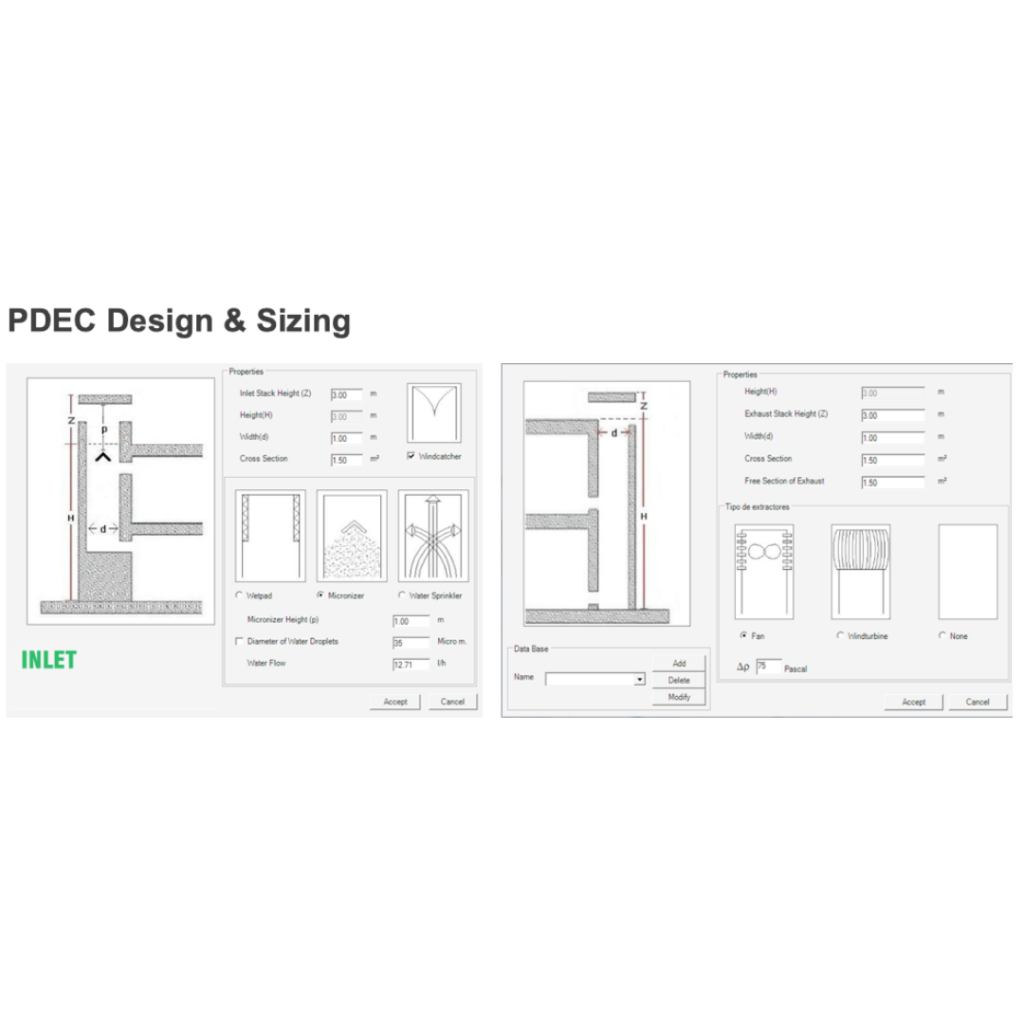
Evaporative Cooling
Lorem ipsum dolor sit amet, consectetur adipiscing elit. Aenean volutpat justo vel semper facilisis. In vitae pellentesque metus. Sed porttitor ultricies pulvinar. Sed pellentesque ante cursus, consequat massa pretium, malesuada ligula. Donec quis imperdiet erat, et blandit mi.
Orci varius natoque penatibus et magnis dis parturient montes, nascetur ridiculus mus. Maecenas vitae orci nibh. Curabitur cursus dui viverra arcu molestie pretium. Nam viverra condimentum fringilla. Suspendisse consectetur mi ut purus tristique bibendum. Quisque quis commodo turpis.
Suspendisse auctor, leo sit amet molestie viverra, lorem sem dapibus libero, sit amet elementum erat arcu sed lorem. Pellentesque feugiat fermentum neque, at ornare nisi sollicitudin eget. Quisque euismod risus risus. Interdum et malesuada fames ac ante ipsum primis in faucibus.
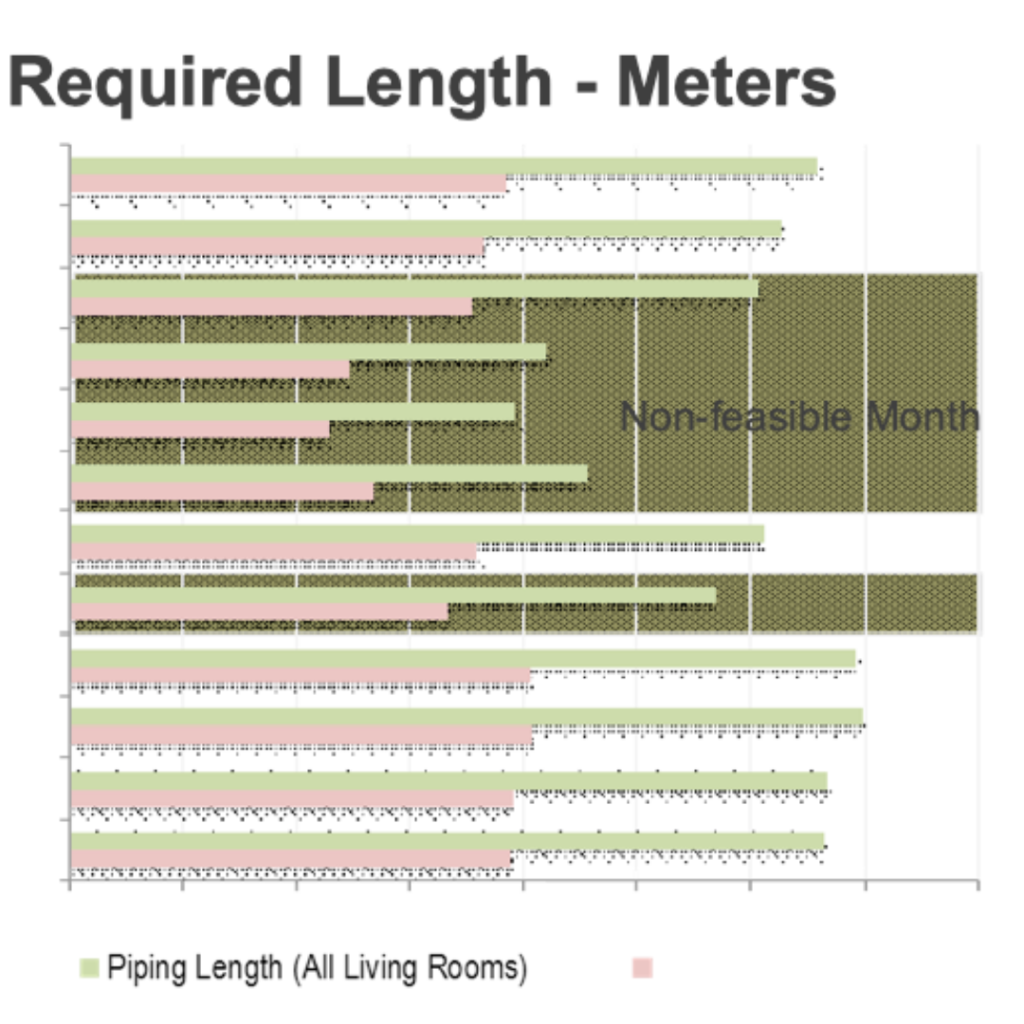
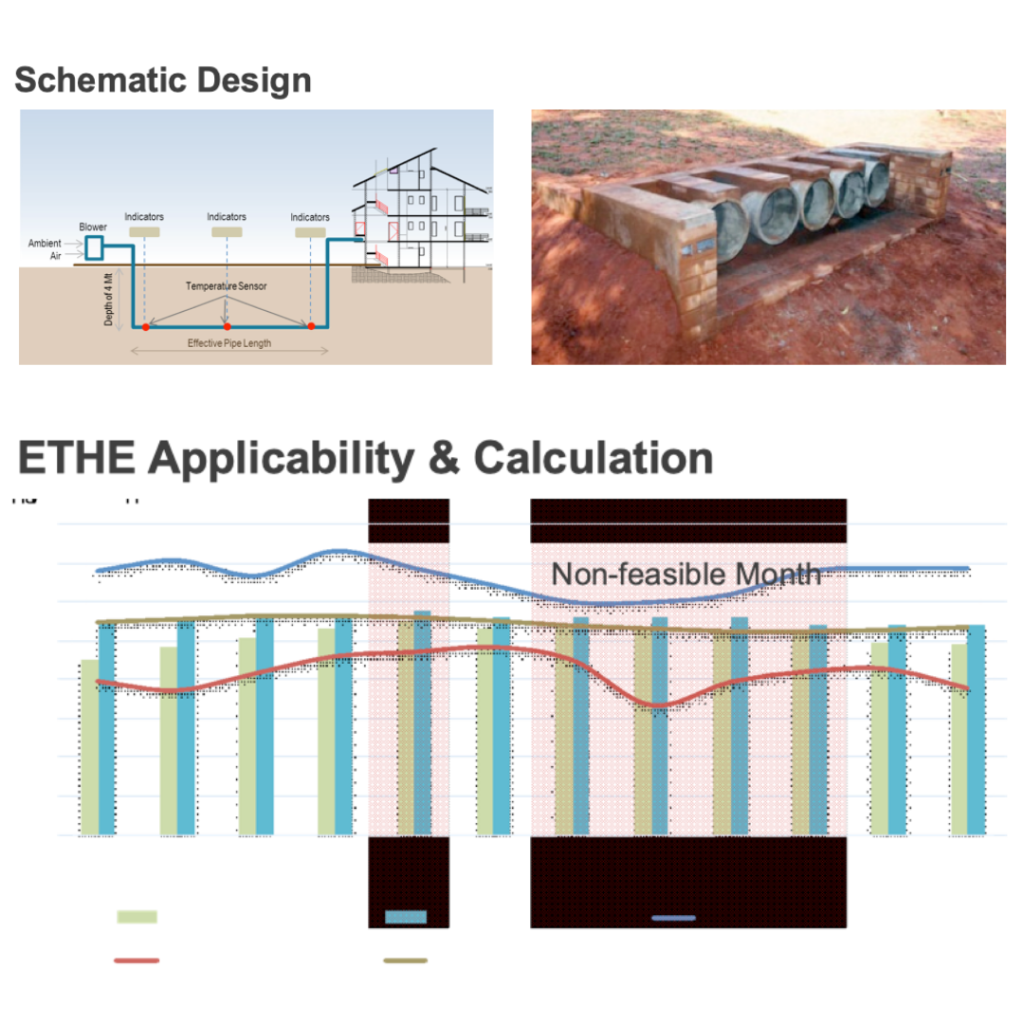
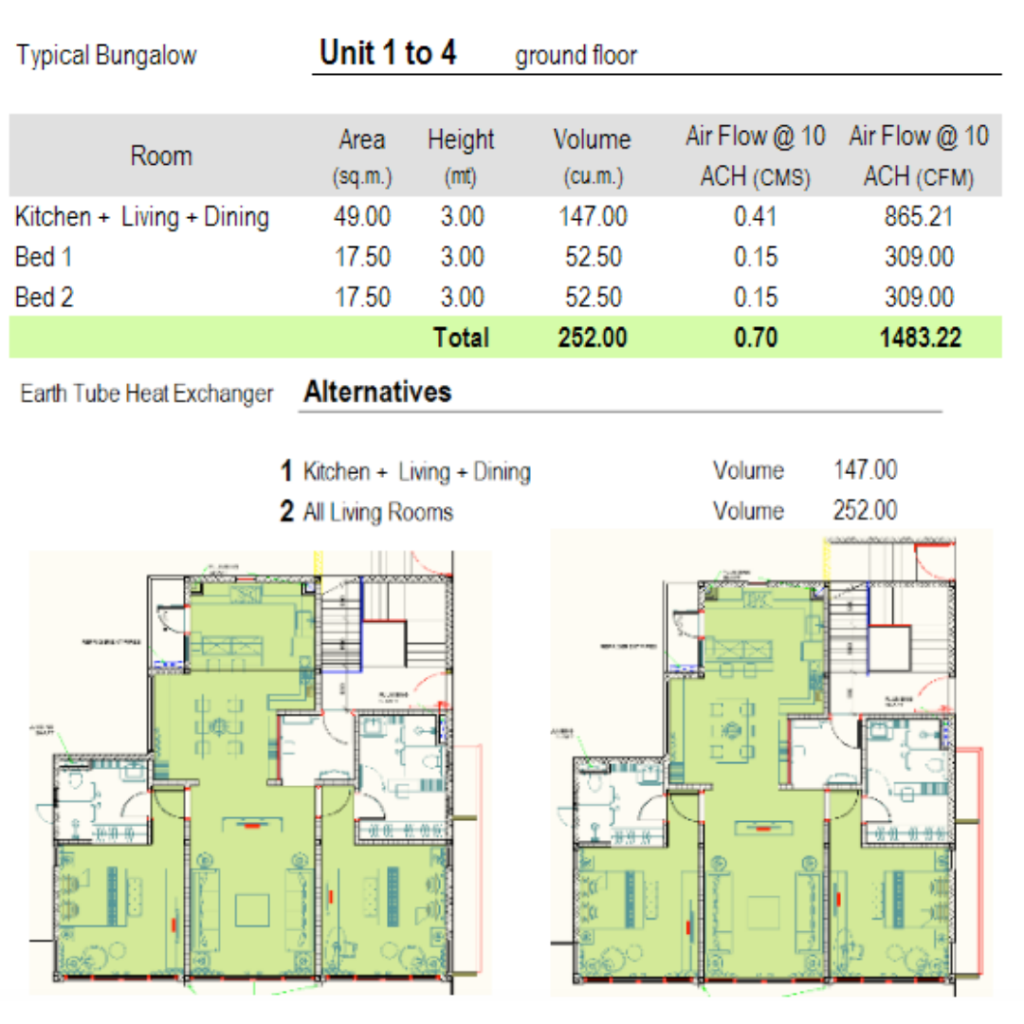
Earth Air Tunnel
Design Parameters
- MS Pipe or PVC Pipe.
- Min. 1 meter distance between two pipes
- Clayey soil to increase effectiveness of the cooling.
- Stack ventilation for further enhancement
- Dew point temperature sensor to avoid condensation.
- Air filters at intake end
ETHE only for Kitchen, Living & Dining Area, total Earth Tube length required is 20 meters with 300mm dia. ETHE for all living spaces, total Earth Tube length required is 35 meters with 300mm dia. This is for single floor of one bungalow. The length will be multiplied accordingly.
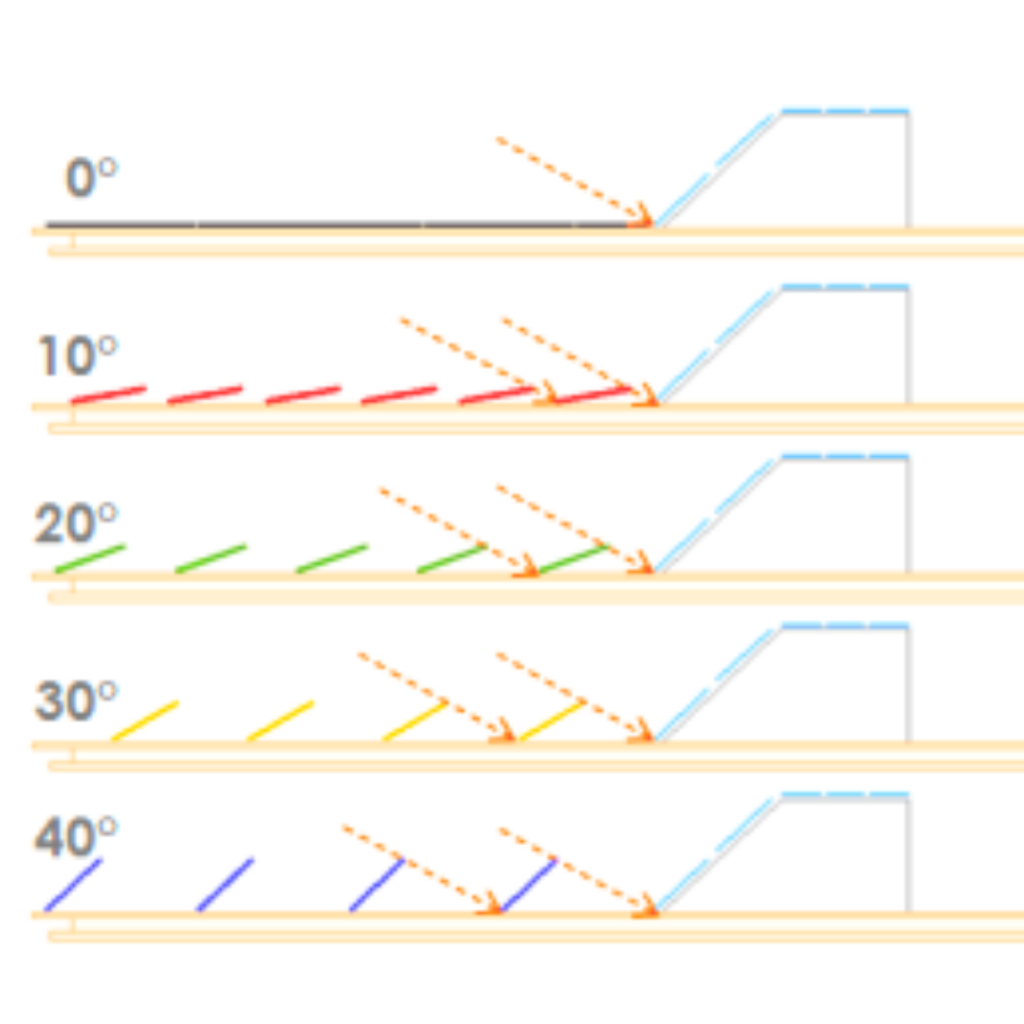
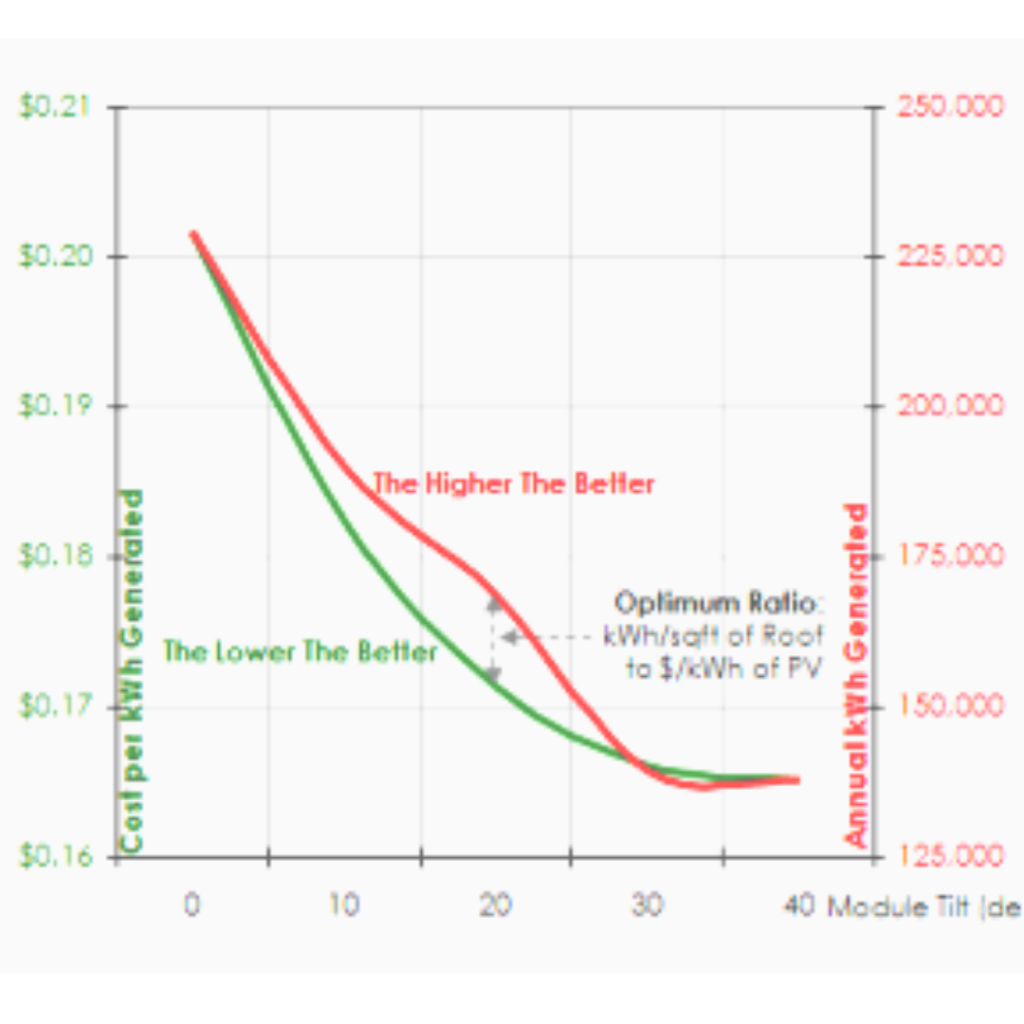
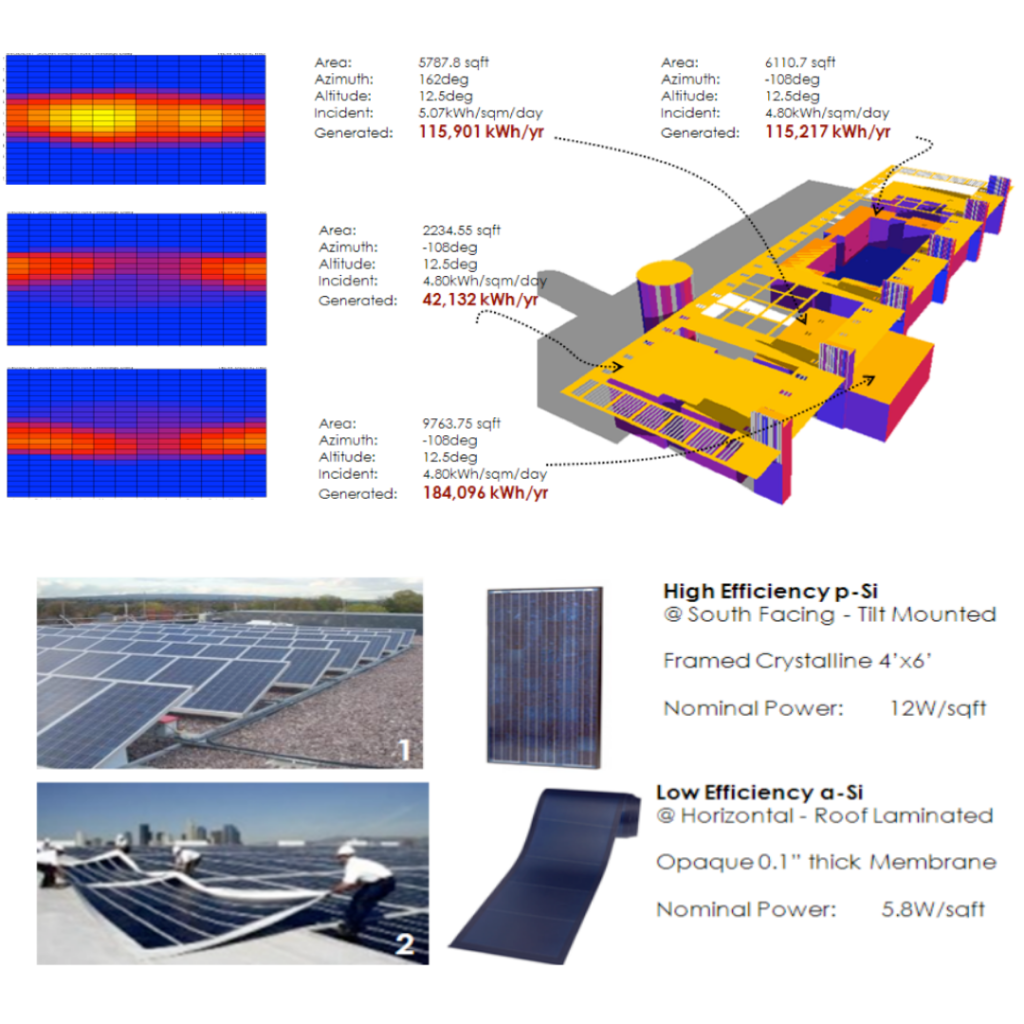
Renewable Energy
Lorem ipsum dolor sit amet, consectetur adipiscing elit. Aenean volutpat justo vel semper facilisis. In vitae pellentesque metus. Sed porttitor ultricies pulvinar. Sed pellentesque ante cursus, consequat massa pretium, malesuada ligula. Donec quis imperdiet erat, et blandit mi.
Orci varius natoque penatibus et magnis dis parturient montes, nascetur ridiculus mus. Maecenas vitae orci nibh. Curabitur cursus dui viverra arcu molestie pretium. Nam viverra condimentum fringilla. Suspendisse consectetur mi ut purus tristique bibendum. Quisque quis commodo turpis.
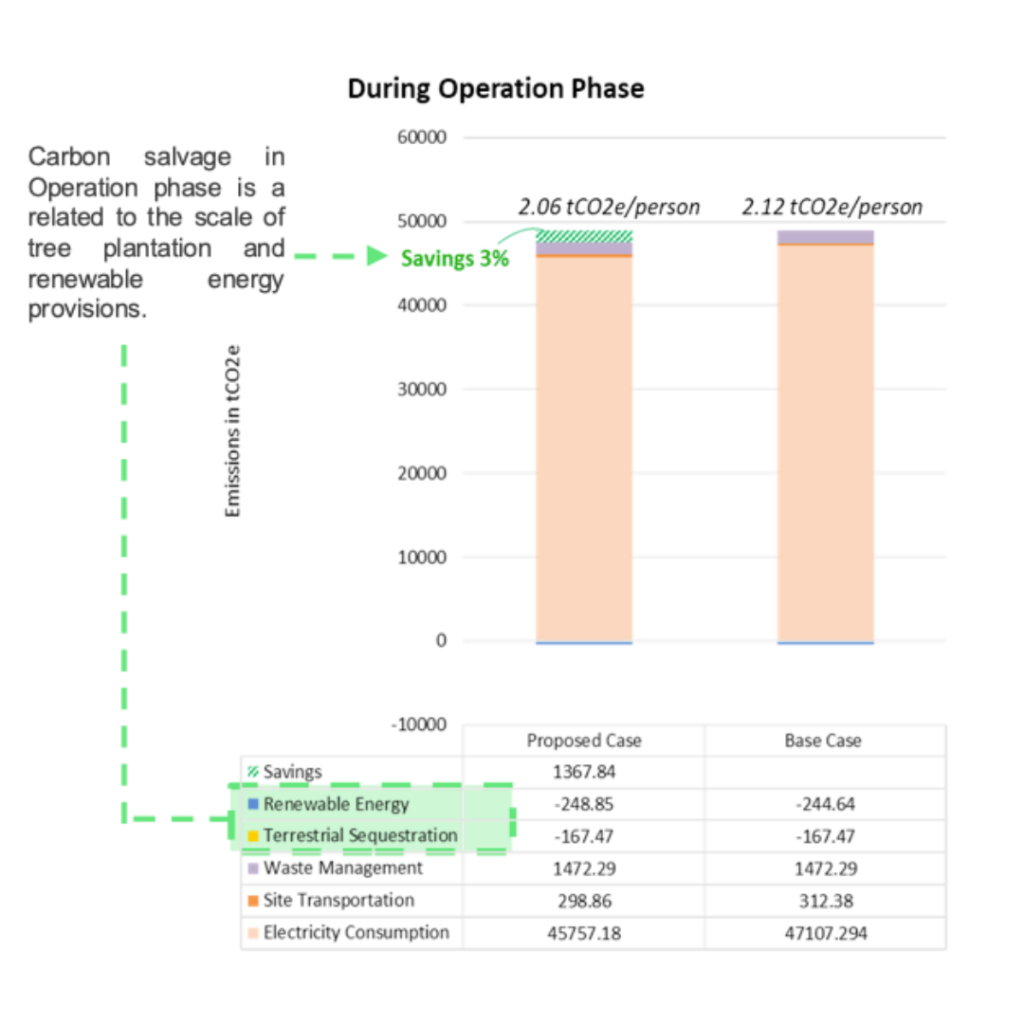
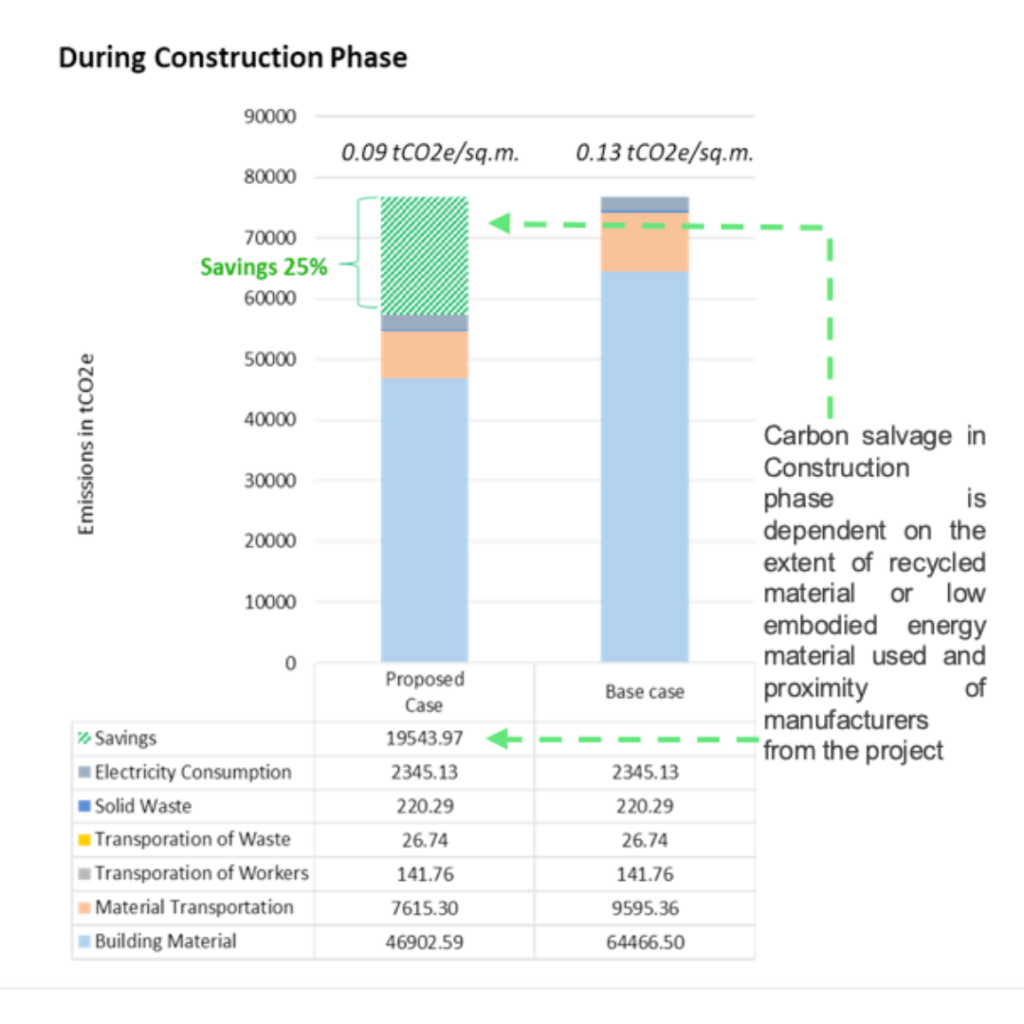
Carbon Footprint Analysis
The charts represents the GHG emissions during the construction and operation phase of a project. The graphs below illustrate the impact of the conservation measures taken during each phase and the reductions achieved is represented in a percentage form as compared to the base case emission scenario. The impact for construction phase is expressed per unit of the construction area and for operation phase it is expressed in emission per capita.
Aspects considered for emission in the construction phase are material embodied energy, use of recycled material, material transport, worker transportation, waste management and electricity consumption.
Aspects considered for calculating the emissions in the operation phase are energy consumption, waste management and vehicular emissions.
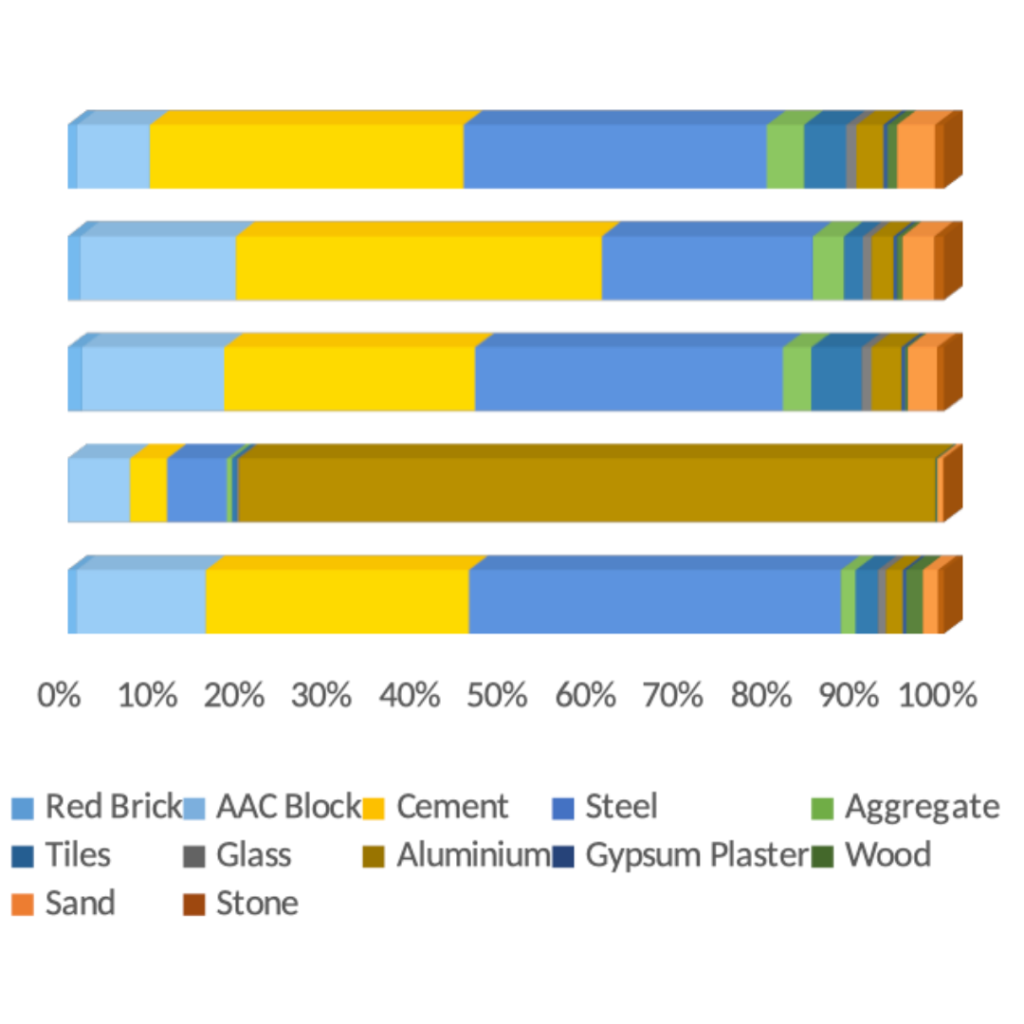
Life Cycle Assessment
The above graph shows the share of each building material in 5 impact categories for the Life cycle emissions from cradle to gate of various building materials for a construction project.
The CO2 emission can be categorized in mainly two parts – During Construction Phase, which is one time; and the During Operation Phase, which continues during the whole life cycle of the project. Similarly, the carbon footprint should be determined over period of time or for the life span of a project.
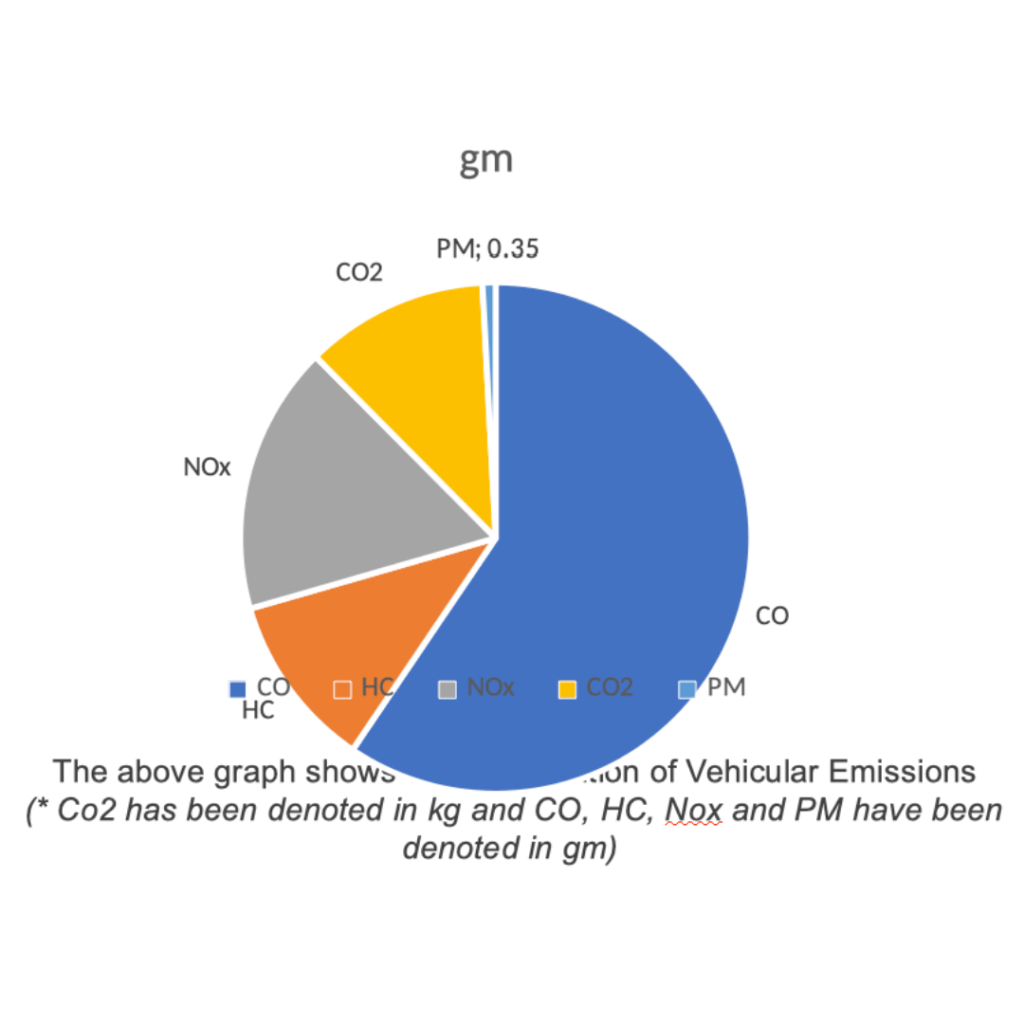
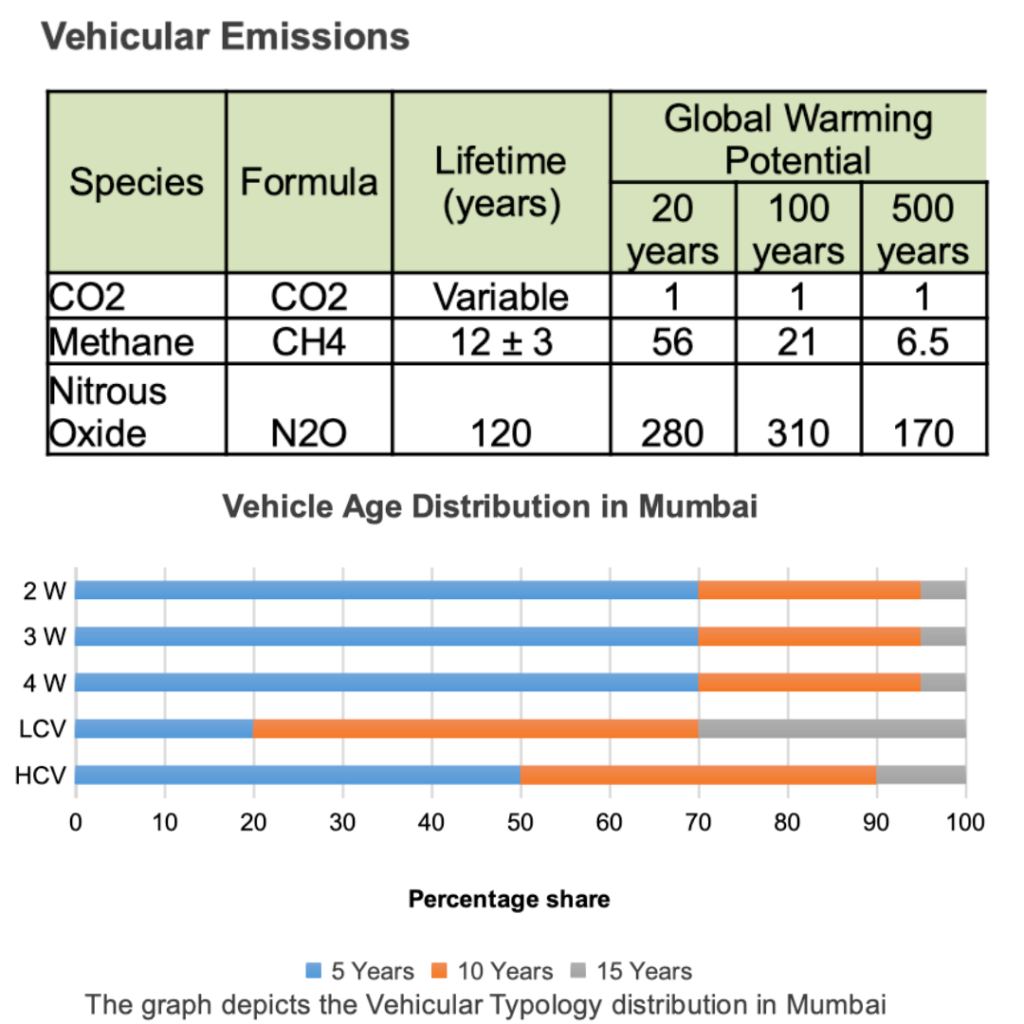
GHG Inventory
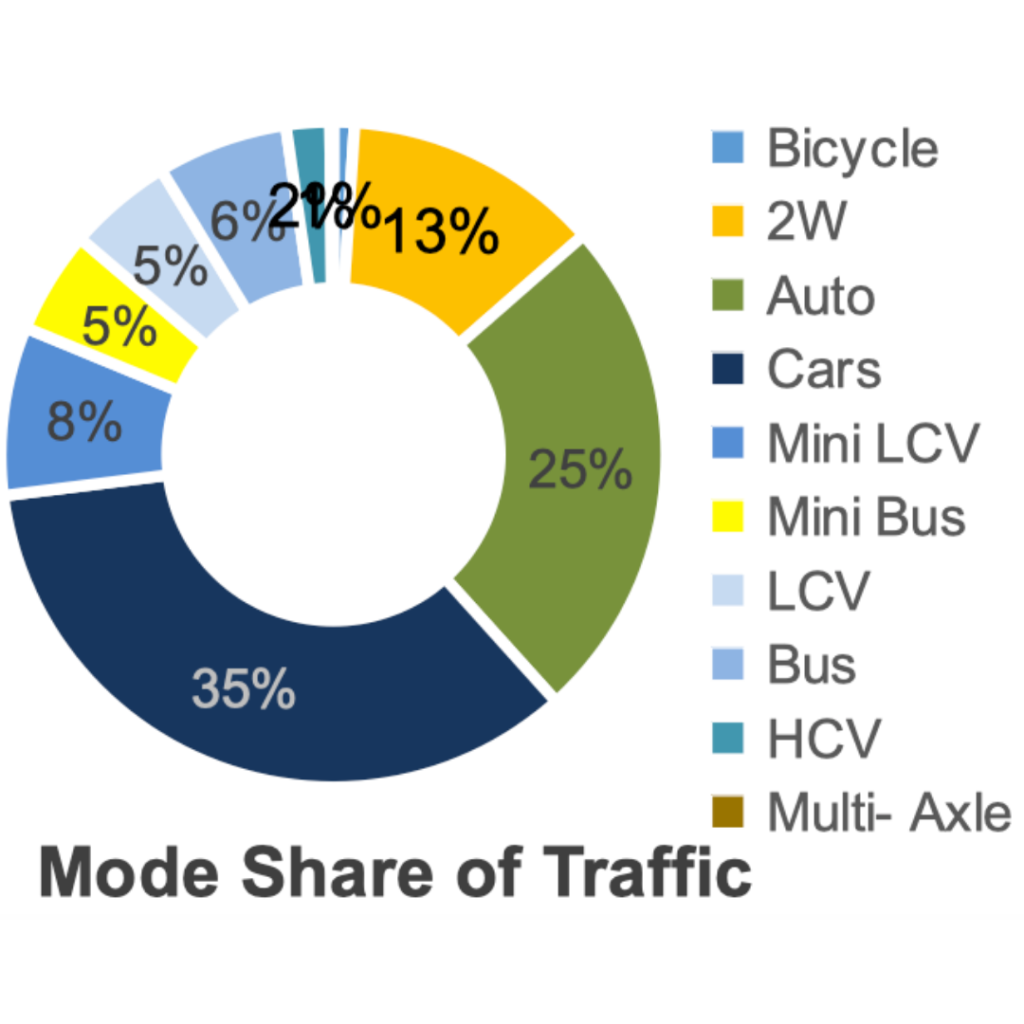
The CO2 emissions that will be caused by a project generated traffic are calculated separately for different categories of vehicles that are expected in the study domain. Selection of appropriate classification is the first step for preparing the pollution inventory. The desired fuel types for intended vehicles are set considering the vehicle data available. The types of fuel namely Petrol, Diesel, CNG and Electric are considered in this study.
The vehicular GHG emissions mainly comprise methane (CH4), nitrous oxide(N2O) and carbon dioxide (CO2). Emission factors as per ARAI are considered for Indian scenario. The largest part of most combustion gas is nitrogen (N2), water vapor (H2O) (except with pure carbon fuels) and carbon dioxide (CO2) (except for fuels without carbon); these are not toxic ornoxious (although carbon dioxide is a greenhouse gas that contributes to global warming).
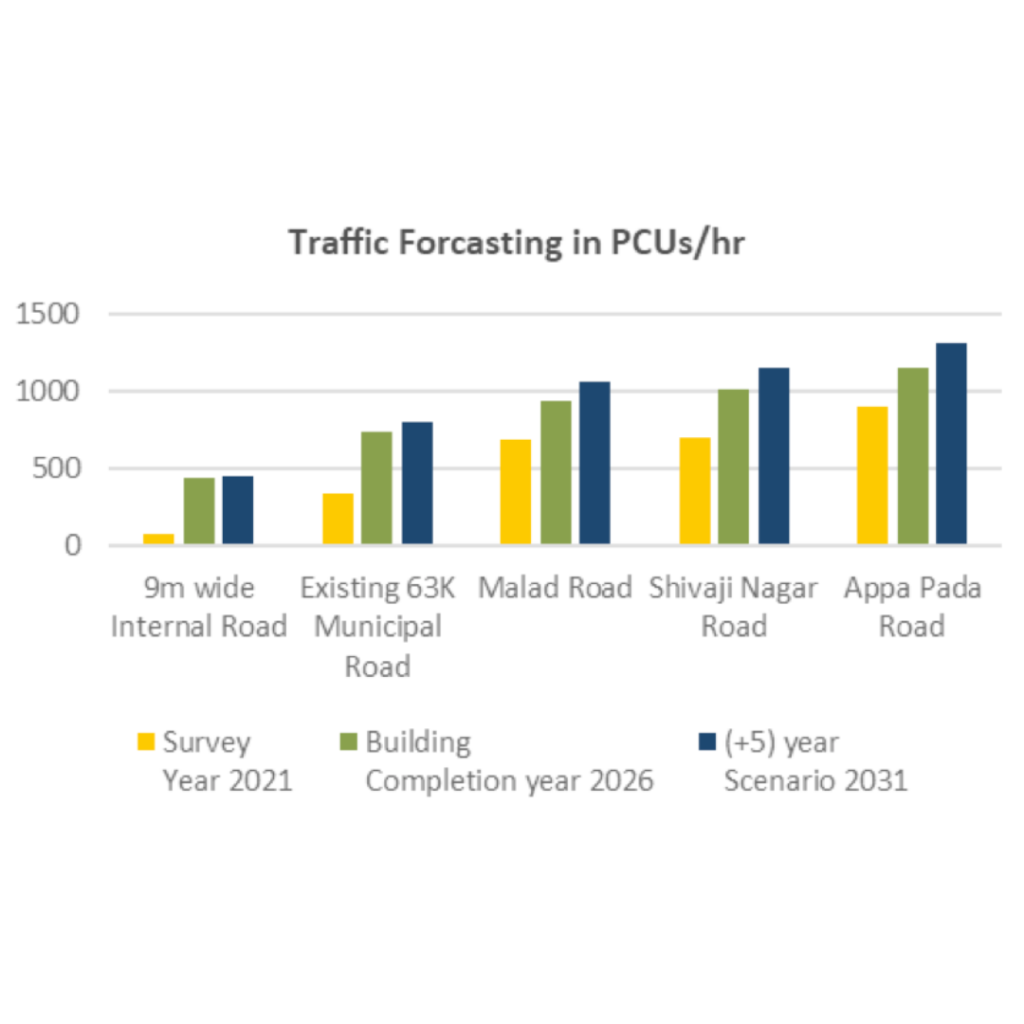
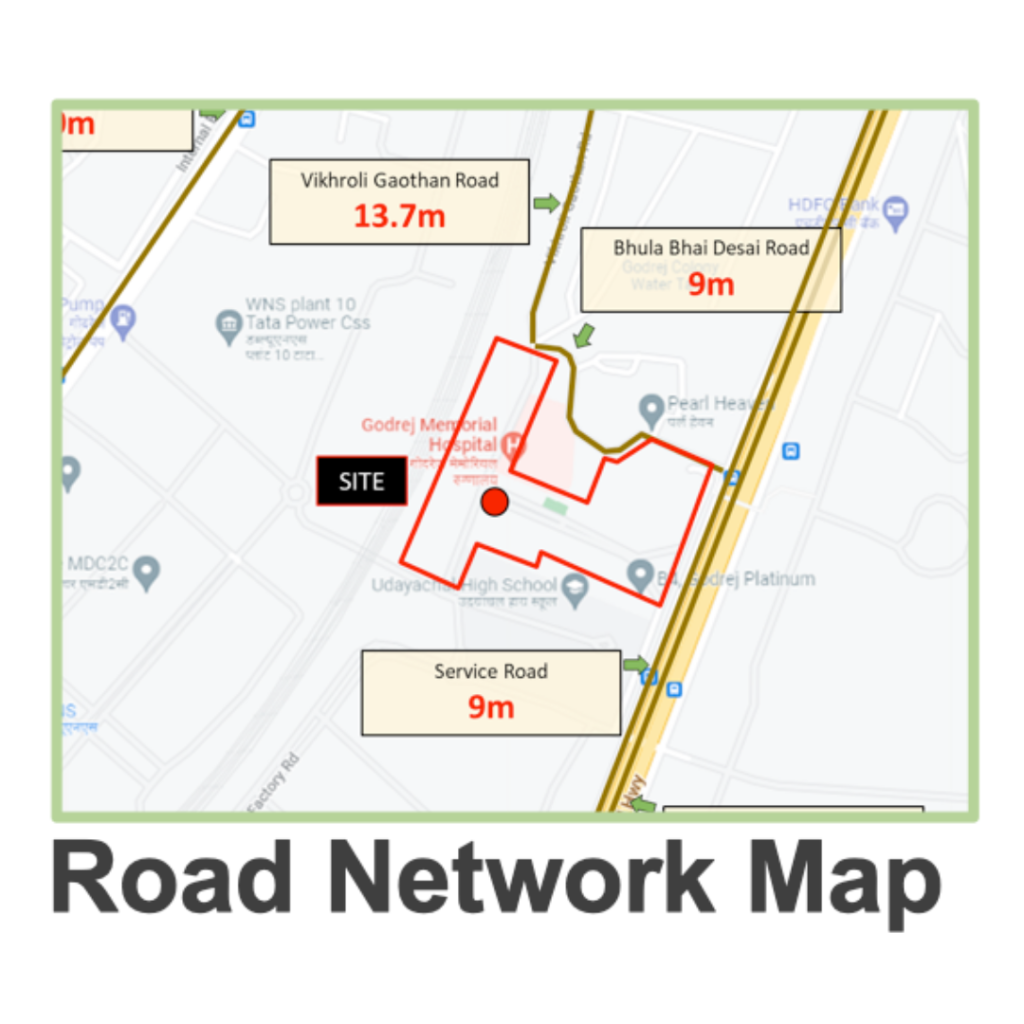
Traffic Impact Assessment
Data Collection from Developer, assessment of project traffic impact zone: The roads are identified for the study Considering 0.5km impact zone from the project boundary.
Forecasting of future traffic demand: The traffic forecasting has been done considering 3% to 5% increase in the road volume depending on the surrounding development for the next 5 to 10 years.
Evaluation of future traffic condition: Examining the capability of the proposed road network system catering to the projected traffic demand in the study area.
The mitigative measures will be recommended to eliminate or alleviate any adverse traffic impacts as results of the proposed new road network system.
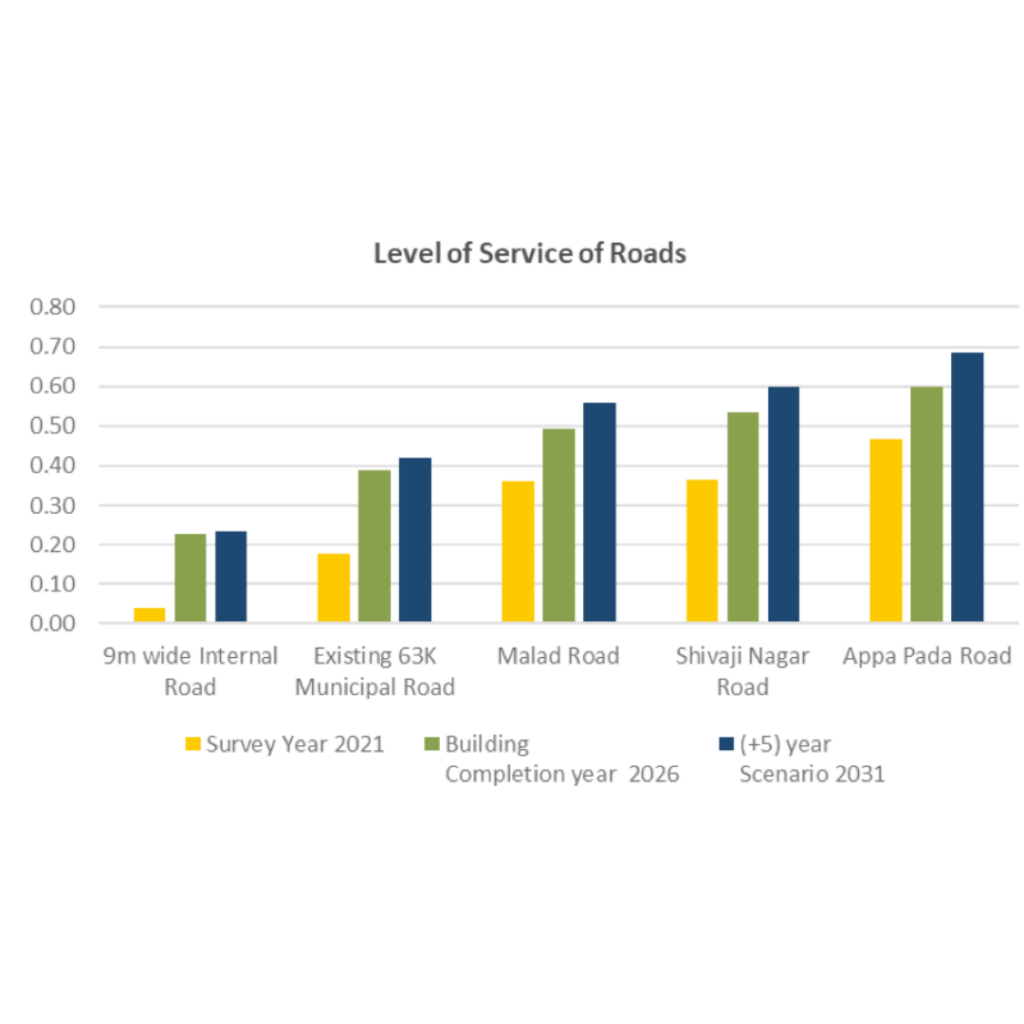
Analysis of Existing traffic conditions: Converting the traffic count survey into Passenger Car Unit (PCU) to account for varying traffic composition. Then the Level of service are shown depending on their Volume to capacity ratio.
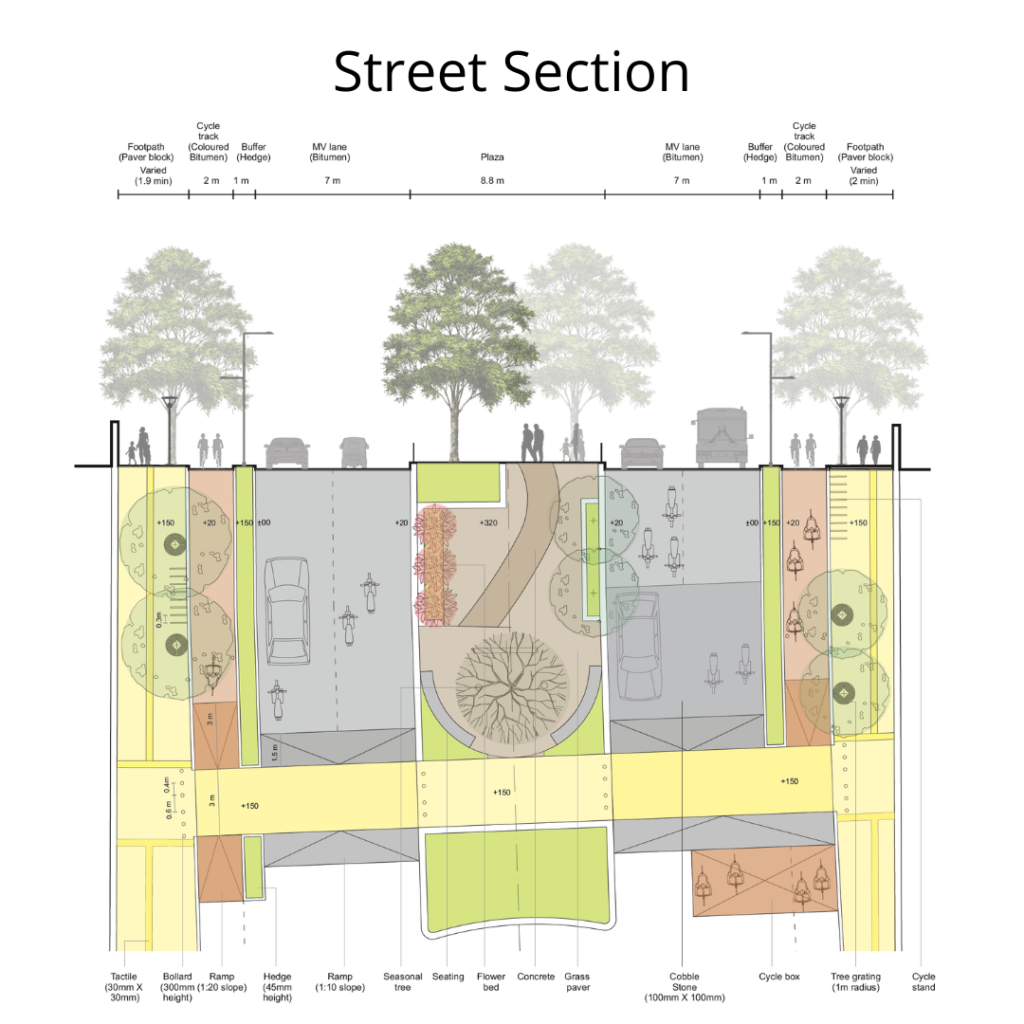
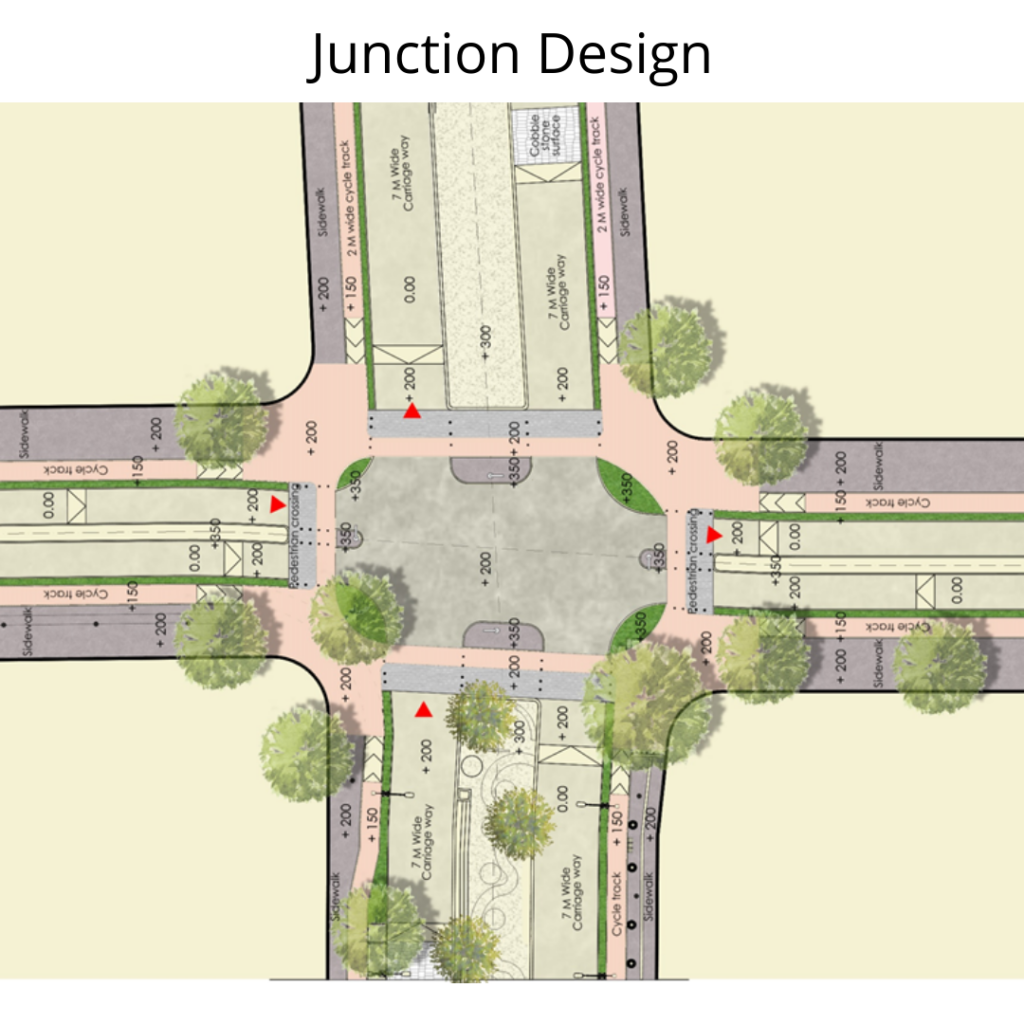
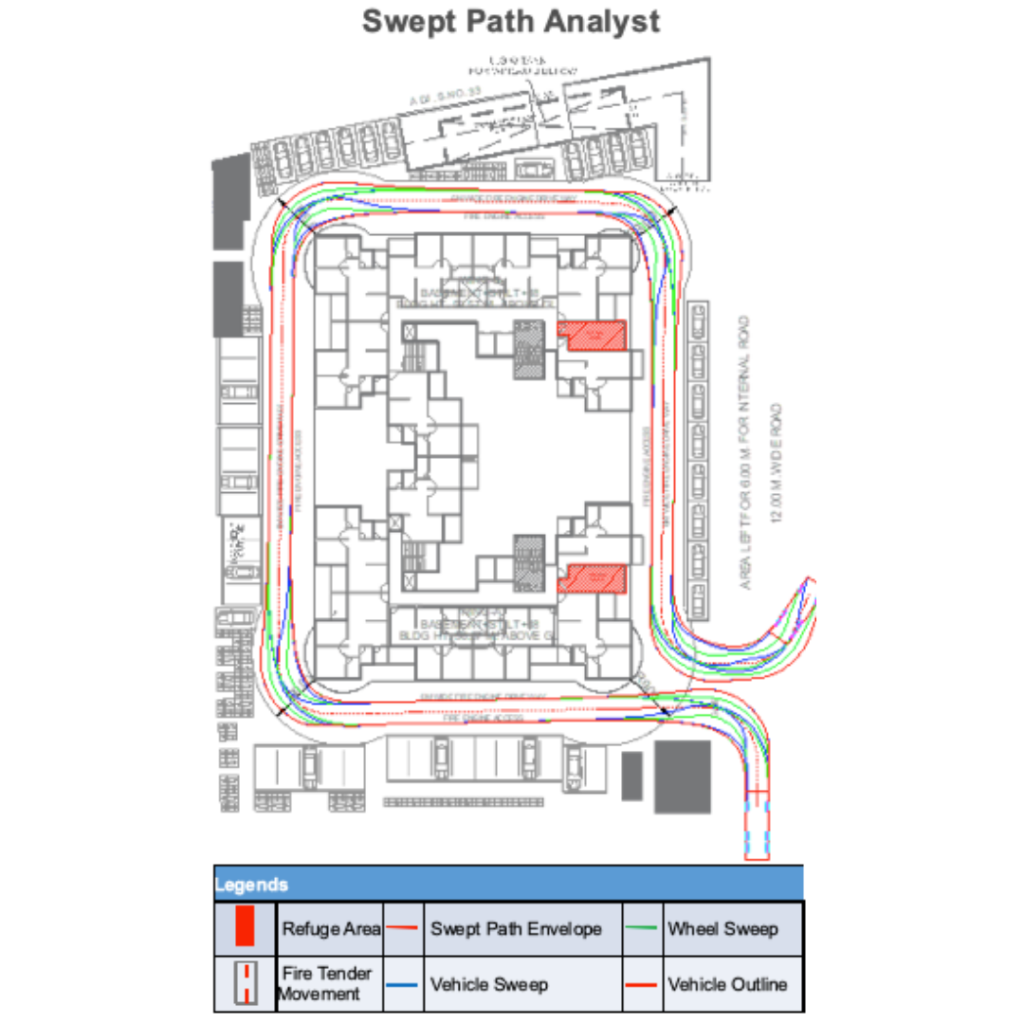
Street and Junction Design
Design Considerations
Volume of pedestrians and vehicles are considered while designing as per IRC standards.
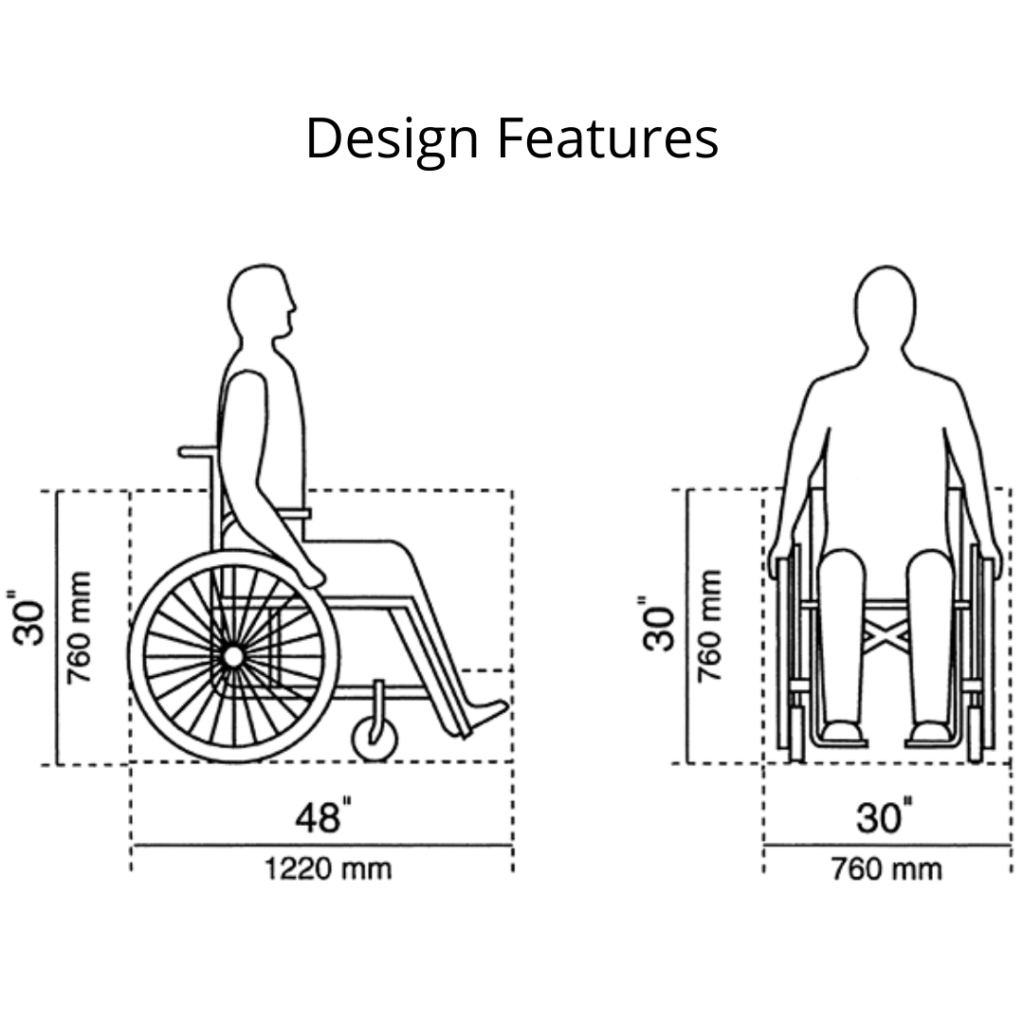
The streets and junctions are designed to provide usability, convenience, accessibility and safety for all its users.
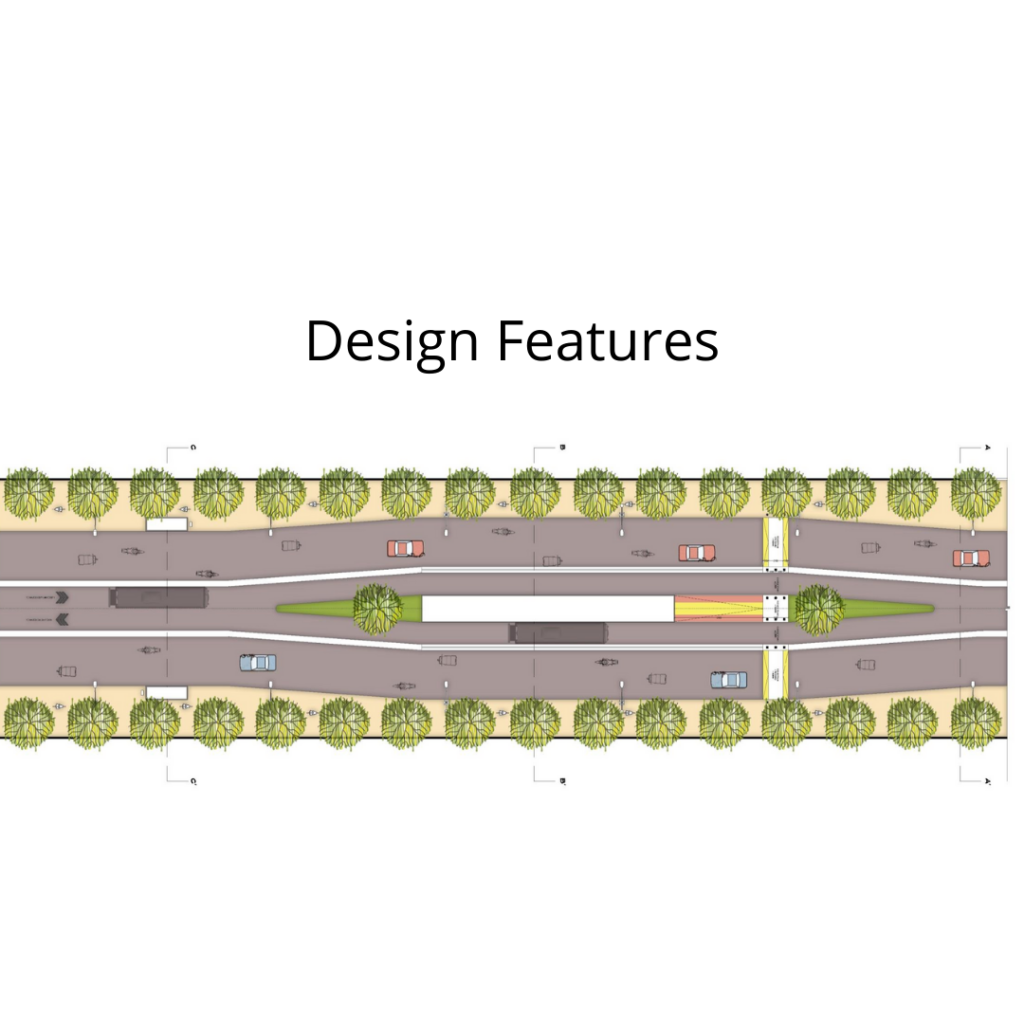
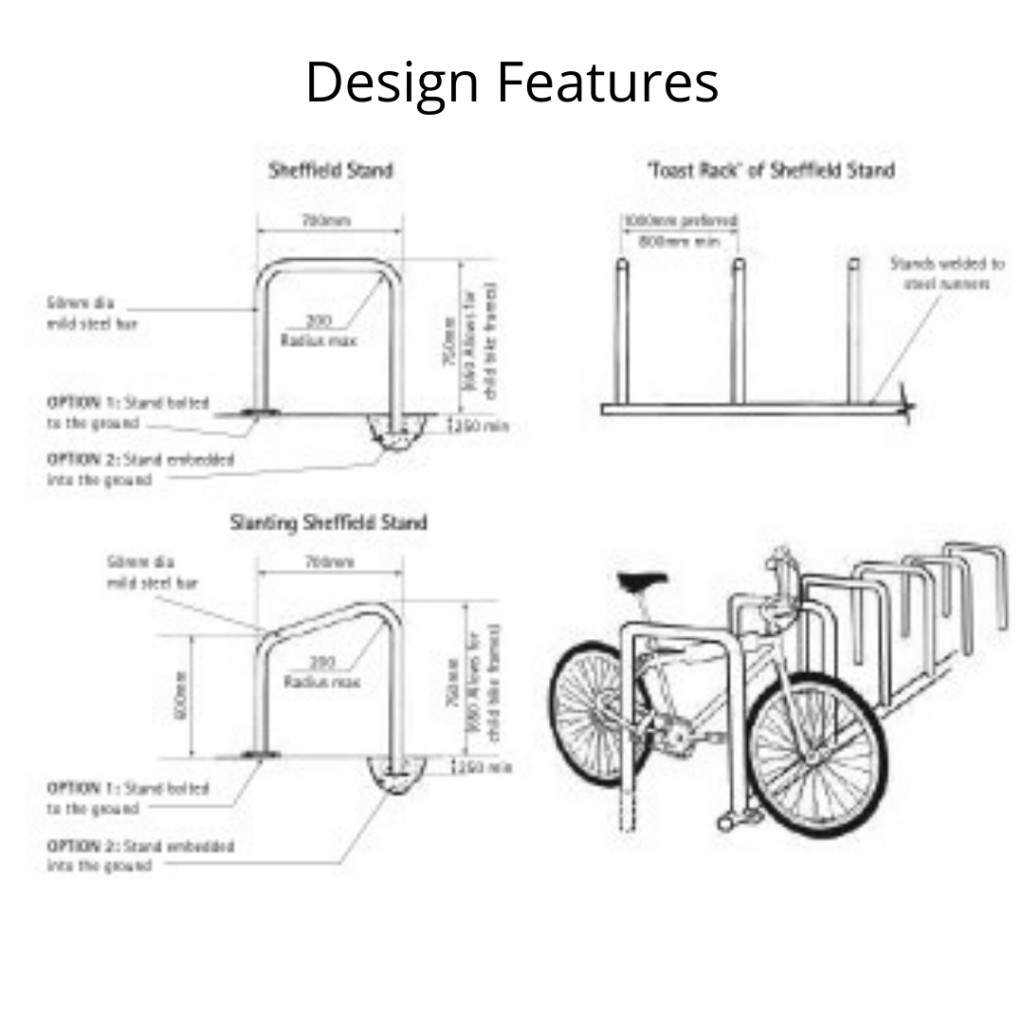
Design Features
To promote Non-Motorised transport, a dedicated cycle track is proposed with sufficient space for cycling.
The designs have dedicated bus lanes to promote public transport.